
Figures & data
Table 1. Baseline characteristics. There were no significant differences in terms of age, sex or race.
Figure 1. No significant differences were seen between richness (A) and diversity (B) between patients with UC and controls. Solids bars represent the mean and the error bars the standard deviation. Principal coordinate analysis of unweighted (C) Unifrac distances showing a significant separation (p = 0.01) and weighted (D) UniFrac distances without a significant separation (p = 0.08) for patients with UC and controls. Red dots represent patients with UC and green dots represent controls. Values in the parenthesis describe the amount of community variation explained along each respective axes.
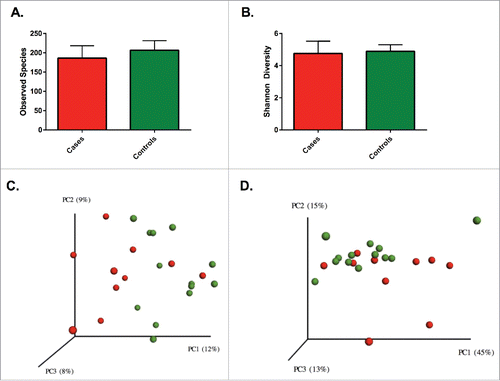
Table 2. Bacterial clades differentially present in patients with UC and controls. Bacterial clades were compared using the White's non-parametric t test with Benjamini Hochberg FDR correction. Clades with a corrected p value <0.05 were considered statistically significant. Data is presented at mean with a standard deviation.
Figure 2. Histogram of LDA effect sizes differentially present between patients with UC and controls with a threshold LDA score of 2. Green bars indicate taxa enriched in controls relative to patients with UC and red bars indicate taxa enriched in patients with UC relative to controls. Numerical identifiers indicate individual OTUs with taxonomic characterization performed against the Greengenes database to the furthest extent.
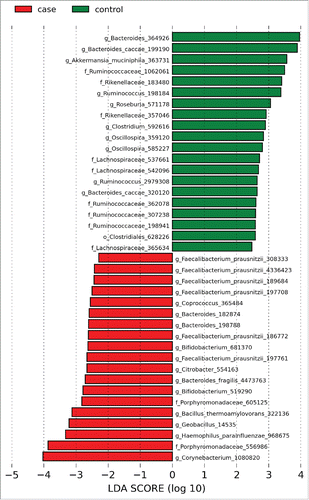
Figure 3. Richness (A) and diversity (B) were similar between patients with and without a clinical response. Solids bars represent the mean and the error bars the standard deviation. No distinct separation of the groups was appreciated with visualization of either unweighted (C) or weighted (D) UniFrac distances (p = 0.87 and p = 0.92, respectively). Yellow dots represent patients with clinical improvement and blue dots those without clinical improvement. Values in the parenthesis describe the amount of community variation explained along each respective axes.
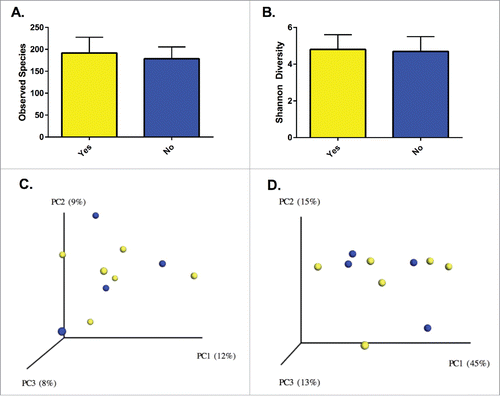
Figure 4. LDA scores demonstrated OTUs for F. prausnitzii associated with both responders and non-responders. OTUs for the genera Clostridium and Bacteroides were increased in patients with UC compared to controls. Green bars indicate taxa enriched in controls relative to patients with UC and red bars indicate taxa enriched in patients with UC relative to controls. Numerical identifiers represent unique OTUs and taxonomic characterization was performed against the Greengenes database to the furthest extent.
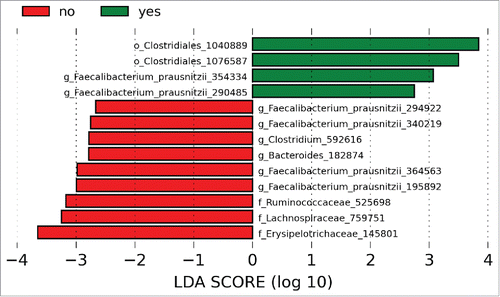
Table 3. Baseline characteristics for the patients with UC. The groups were not significantly different and were initiated on similar therapies. The responders consisted of patients with less extensive disease, but similar numbers of patients with pancolitis as the non-responder group.