2,242
Views
53
CrossRef citations to date
0
Altmetric
Research Paper/Report

Caloric restriction promotes rapid expansion and long-lasting increase of Lactobacillus in the rat fecal microbiota

, , , , , , ORCID Icon, ORCID Icon, & ORCID Icon show all
Pages 104-114 | Received 10 Mar 2017, Accepted 22 Aug 2017, Published online: 21 Sep 2017

Figures & data

Figure 1. Growth curves of young growing (A) and adult (B) rats during ad libitum (AL, red) and caloric restriction (CR, green) treatment. Arrows indicate the different weeks at which stools were collected, while the first point in which the two groups exhibit a statistically significant difference in weight is marked with an asterisk.

Figure 1. Growth curves of young growing (A) and adult (B) rats during ad libitum (AL, red) and caloric restriction (CR, green) treatment. Arrows indicate the different weeks at which stools were collected, while the first point in which the two groups exhibit a statistically significant difference in weight is marked with an asterisk.

Figure 2. Beta-diversity at OTU level between ad libitum (AL, red) and caloric restriction (CR, green) groups before (T0, A) and after 3 weeks of treatment (3W, B) in young rats. Principal component analysis (PCA) was carried out on even OTU table data.

Figure 2. Beta-diversity at OTU level between ad libitum (AL, red) and caloric restriction (CR, green) groups before (T0, A) and after 3 weeks of treatment (3W, B) in young rats. Principal component analysis (PCA) was carried out on even OTU table data.

Figure 3. Top 10 genera within the young rats gut microbiota fed ad libitum (AL, left) and with caloric restriction (CR, right). Genera are ordered by decreasing median of the relative abundance among subjects at 1 week before treatment (A), 3 weeks (B), and 8 weeks of treatment (C). Boxes are colored based on the phylum membership (blue, Firmicutes; purple, Bacteroidetes). Asterisks indicate significant difference (P < 0.05) between AL and CR rats at same time of treatment, with the asterisk corresponding to the group in which a given genus was more abundant.
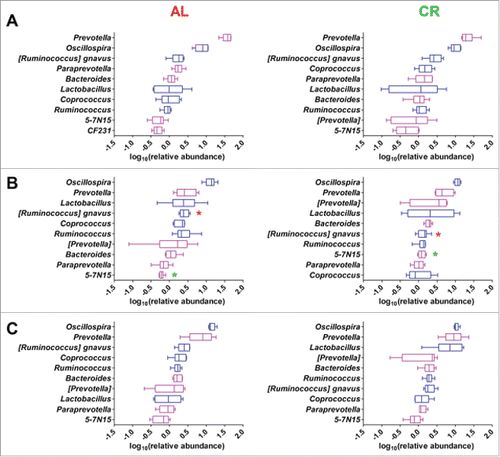
Figure 3. Top 10 genera within the young rats gut microbiota fed ad libitum (AL, left) and with caloric restriction (CR, right). Genera are ordered by decreasing median of the relative abundance among subjects at 1 week before treatment (A), 3 weeks (B), and 8 weeks of treatment (C). Boxes are colored based on the phylum membership (blue, Firmicutes; purple, Bacteroidetes). Asterisks indicate significant difference (P < 0.05) between AL and CR rats at same time of treatment, with the asterisk corresponding to the group in which a given genus was more abundant.

Figure 4. Relative abundance variation of genera in young rats fecal microbiota after 8 weeks of ad libitum (AL) or caloric restriction (CR) diets. Only genera with a relative abundance > 1% in at least one time point and significant variation at 8 weeks are represented. Each dot represents a different sample, with the same combination shape-color indicating the same rat. Samples were evaluated 1 week before treatment (T0) and after 3 weeks (3W) and 8 weeks of treatment (8W). Asterisks indicate significant difference (*P < 0.05, **P < 0.01, ***P < 0.001) within AL and CR groups between different time points.
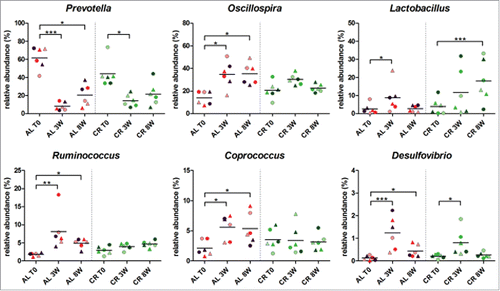
Figure 4. Relative abundance variation of genera in young rats fecal microbiota after 8 weeks of ad libitum (AL) or caloric restriction (CR) diets. Only genera with a relative abundance > 1% in at least one time point and significant variation at 8 weeks are represented. Each dot represents a different sample, with the same combination shape-color indicating the same rat. Samples were evaluated 1 week before treatment (T0) and after 3 weeks (3W) and 8 weeks of treatment (8W). Asterisks indicate significant difference (*P < 0.05, **P < 0.01, ***P < 0.001) within AL and CR groups between different time points.

Figure 5. Fecal microbiota of ad libitum (AL, left) and caloric restriction (CR, right) treated adult rats. Boxplots show the top 10 microbial families (A) and genera (B). Features are ordered by decreasing median of the relative abundance among subjects. Boxes are colored based on the phylum membership (blue, Firmicutes; purple, Bacteroidetes; orange, Proteobacteria). Asterisks indicate significant difference (P < 0.05) between AL and CR rats at same time of treatment, with the asterisk color corresponding to the group in which a given genus was more abundant.

Figure 5. Fecal microbiota of ad libitum (AL, left) and caloric restriction (CR, right) treated adult rats. Boxplots show the top 10 microbial families (A) and genera (B). Features are ordered by decreasing median of the relative abundance among subjects. Boxes are colored based on the phylum membership (blue, Firmicutes; purple, Bacteroidetes; orange, Proteobacteria). Asterisks indicate significant difference (P < 0.05) between AL and CR rats at same time of treatment, with the asterisk color corresponding to the group in which a given genus was more abundant.

Figure 6. Heatmap showing the relative log-transformed abundance distribution of Lactobacillus spp. OTUs among all samples. OTUs with >0.01% of relative abundance in at least one group at one time point were selected. Columns are hierarchically ordered based on the experiment, treatment (ad libitum, red; caloric restriction, green), and time point.
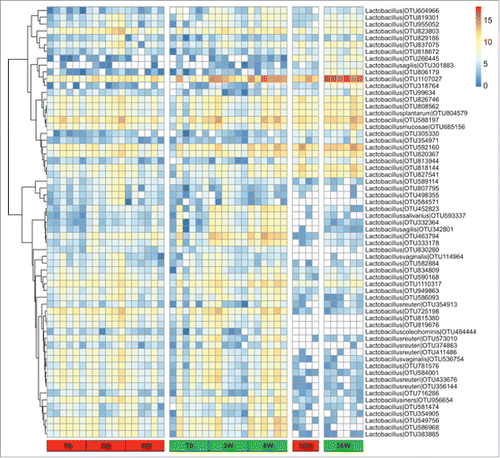
Figure 6. Heatmap showing the relative log-transformed abundance distribution of Lactobacillus spp. OTUs among all samples. OTUs with >0.01% of relative abundance in at least one group at one time point were selected. Columns are hierarchically ordered based on the experiment, treatment (ad libitum, red; caloric restriction, green), and time point.
Supplemental material

KGMI_A_1371894_Supplemental.zip

Download Zip (629.3 KB)

Reprints and Corporate Permissions

Please note: Selecting permissions does not provide access to the full text of the article, please see our help page How do I view content?

To request a reprint or corporate permissions for this article, please click on the relevant link below:

Academic Permissions

Please note: Selecting permissions does not provide access to the full text of the article, please see our help page How do I view content?

Obtain permissions instantly via Rightslink by clicking on the button below:

If you are unable to obtain permissions via Rightslink, please complete and submit this Permissions form. For more information, please visit our Permissions help page.