
Figures & data
Table 1. ANOSIM analysis of the effect of reproductive status on bacterial gut microbiota in rats fed a standard chow and high-fat diet in experiment 1.
Table 2. Variation partitioning of the relative effect of diet and reproductive experience on the composition of bacterial microbiota on rats fed either standard chow or a high-fat diet (experiment 1).
Figure 1. (A) Mean body weight (±SEM, g) of nulliparous (NULL) rats fed either a standard chow or HF diet for 13–14 days. *Significantly different from the standard chow group. aSignificantly different from the day 0 of the diet (p < .05); (B) Mean body weight (±SEM, g) of reproductive experience (RE) rats fed either a standard chow or HF diet on gestation day 1 (day 0 of the diet s), lactation day 1 (day 23 of the diet) and day of euthanasia (day 32 of the diet). There was a significant main effect of time (see text).
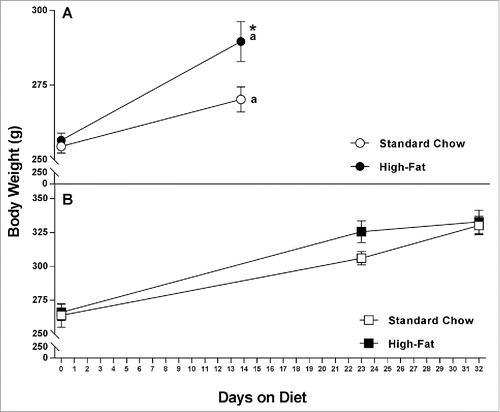
Figure 2. Principal Coordinate Analysis of fecal microbiota from NULL, pregnant and lactating rats 1 on a standard chow (panel A) or HF diet(panel B). Composition of gut microbiota segregates according to reproductive status in rats fed a diet high in fat but not in rats on a standard chow diet. HF diet: n = 14 total; low-fat diet: n = 18 total.
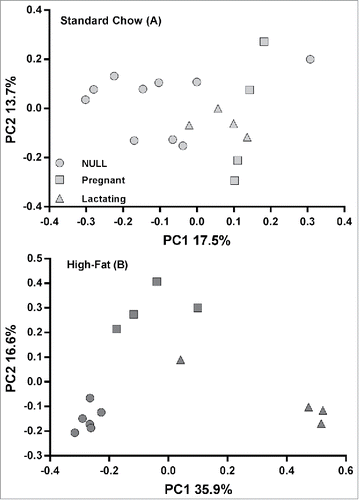
Figure 3. Mean body weight (±SEM, g) of either NULL or RE rats fed a HF diet for 30 days. *Significantly different between NULL and RE groups (p's < .05).
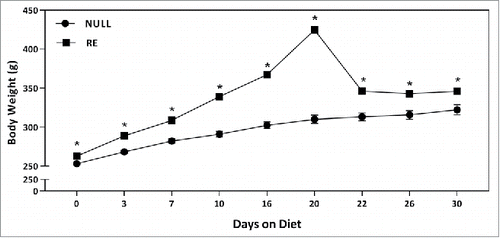
Figure 4. Principal Coordinate Analysis of fecal microbiota from NULL, pregnant and lactating rats 10 days or longer on a HF diet in experiment 2 (n = 57).
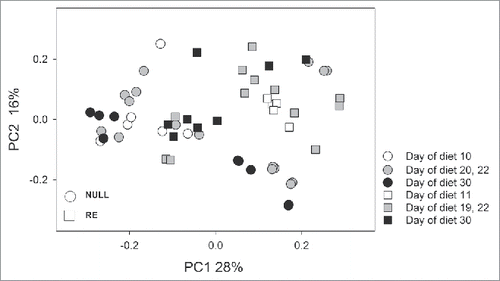
Figure 5. Firmicutes-to-Bacteroidetes abundance ratio increases with time on HF diet. Empty circles, nulliparous (NULL) rats; full circles, reproductive experience (RE) rats.
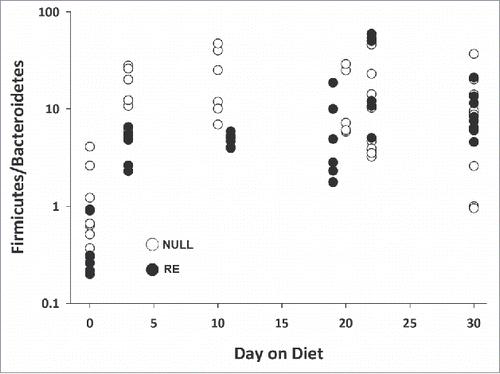
Figure 6. Weight gain of rats on a HF diet correlates with lower α diversity. α diversity was estimated using the Shannon index and the reverse Simpson (1/D) index and plotted against weight gain (n = 9).
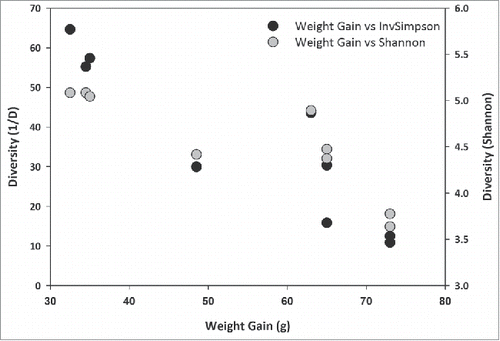
Figure 7. Research design for experiments 1 and 2. The horizontal axis shows the time scale, where Day 0 is the day the animals in the HF groups were switched to HF diet. The same time scale is used throughout the text. Days underlined and larger are the approximate times that fecal samples were obtained. Vertical arrows indicate when the HF diet group was placed on the diet. Null: nulliparous, cycling females; RE: reproductively experienced females.
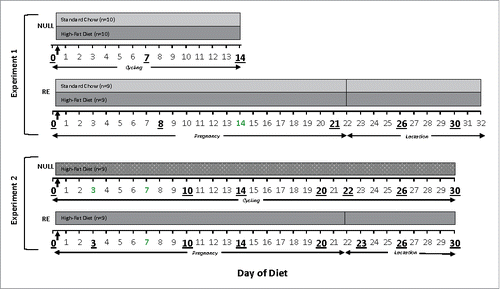
Table 3. ANOSIM of experiment 2 microbiota of NULL, pregnant, and lactating rats on a high-fat diet in for 10 days or longer.
Table 4. Variation partitioning of the relative effect of diet and reproductive experience on the composition of bacterial microbiota in rats on a high-fat diet (experiment 2).