Figures & data
Table 1. Fasting biochemical and dietary characteristics of pregnant women at 16 weeks gestation according to maternal BMI.
Table 2. Metabolic parameters and their correlation with genus Collinsella abundance at 16 weeks gestation.
Figure 1. Collinsella relative abundance and maternal circulating insulin. (A) Positive correlation between genus Collinsella and insulin levels in overweight (black) and obese pregnant women (grey). (B) Collinsella abundance in overweight (black) and obese (grey) pregnant women.
Figure 2. Connections between Collinsella relative abundance, circulating insulin and dietary fiber intake. (A) Negative correlation between dietary fiber intake and Collinsella relative abundance. (B) Comparison of genus Collinsella between women with low and high dietary fiber intake. (C) Negative correlation between dietary fiber intake and insulin levels in overweight and obese pregnant women.
Figure 3. Differences in microbiota composition according to high and low fiber intake. (A) Network analysis based on high (n = 13) and low (n = 13) dietary fiber intake. Genera are represented as nodes. Green nodes represent genera overrepresented in the low-fiber group. Red nodes represent genera overrepresented in the high-fiber group. Color intensity explains the strength of the associations with fiber intake. (B) Principal component analysis showing the clustering of selected samples based on high (red) and low (green) fiber intake. (C) Identification of significant associations between low and high dietary fiber groups by Anosim test.
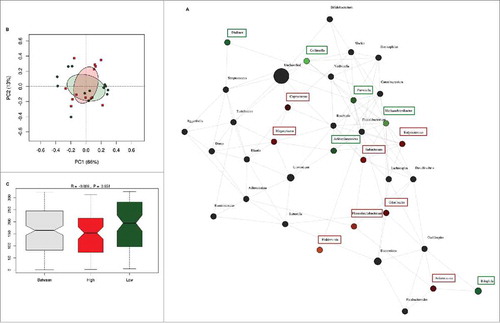
Figure 4. Network analysis after correction of dietary fiber by total energy intake. (A) Network analysis based on high (n = 13) and low (n = 13) dietary fiber intake. Genera are represented as nodes. Green nodes represent genera overrepresented in the low-fiber group. Red nodes represent genera overrepresented in the high-fiber group. Color intensity explains the strength of the associations with fiber intake. (B) Principal component analysis showing the clustering of selected samples based on high (red) and low (green) fiber intake. (C) Identification of significant associations between low and high dietary fiber groups by Anosim test.
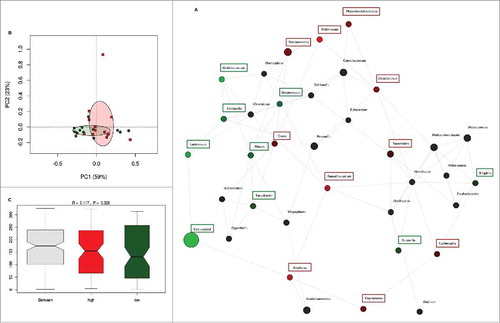
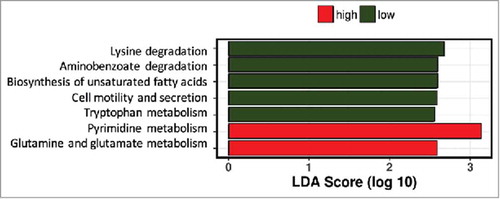
Figure 5. Predictive function analysis of gut microbiota profiles of women with low or high dietary fiber intake. Pathways predicted to be upregulated in women with low fiber intake in green bars, those upregulated in women with high fiber intake in red bars.