Figures & data
Figure 1. The experiment was designed as four factor factorial experiment with two levels of time (7 and 14 days post-inoculation [p.i.]), two levels of cecum (i.e. mice that underwent sham [Cec-] or cecectomy [Cec+] surgery), two levels of inflammation (mice that were orally administered phosphate buffered saline [CR-] or Citrobacter rodentium [CR+]), and two levels of butyrate (i.e. mice were administered phosphate buffered saline [But-] or butyrate [But+] via enemas every second day p.i.). Thus, 16 mice were included in each replicate, and four replicates were conducted on separate occasions equaling 64 mice in total.
![Figure 1. The experiment was designed as four factor factorial experiment with two levels of time (7 and 14 days post-inoculation [p.i.]), two levels of cecum (i.e. mice that underwent sham [Cec-] or cecectomy [Cec+] surgery), two levels of inflammation (mice that were orally administered phosphate buffered saline [CR-] or Citrobacter rodentium [CR+]), and two levels of butyrate (i.e. mice were administered phosphate buffered saline [But-] or butyrate [But+] via enemas every second day p.i.). Thus, 16 mice were included in each replicate, and four replicates were conducted on separate occasions equaling 64 mice in total.](/cms/asset/5a7dd665-92d7-4ee2-b403-85ce95edfa13/kgmi_a_1408763_f0001_b.gif)
Figure 2. Concentration of: (A) total short chain fatty acids; (B) acetic acid; (C) butyric acid; (D) isobutyric acid; (E) valeric acid; (F) isovaleric acid; (G) propionic acid; and (H) caproic acid in feces from mice that received sham (Cec-) or cecectomy (Cec+) surgery and were orally administered PBS (CR-) or Citrobacter rodentium (CR+). Fatty acids were measured in feces collected prior to surgery (pre-surgery), between surgery and inoculation (post-surgery), and after administration of C. rodentium or PBS. Vertical lines associated with histogram bars represent standard error of the means (n = 10 to 15 mice/treatment). *P ≤ 0.050, ***P ≤ 0.001.

Figure 3. Alpha diversity of bacterial communities in the proximal (A) and distal (B) colon of mice that received sham (Cec-) or cecectomy (Cec+) surgeries and were orally administered PBS (CR-) or Citrobacter rodentium (CR+) 14 days post-inoculation. Vertical lines associated with histogram bars represent standard error of the means (n = six to eight mice/treatment).
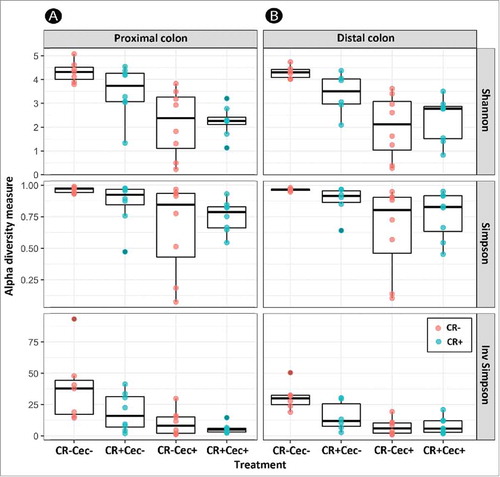
Figure 4. Principal component analysis based on Bray-Curtis dissimilarity in bacterial communities in the proximal (A) and distal (B) colon of mice that received sham (Cec-) or cecectomy (Cec+) surgeries 14 days post-inoculation.
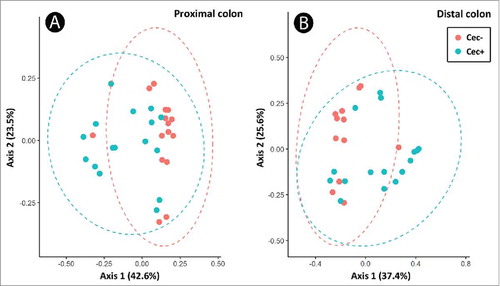
Figure 5. Relative abundance of bacteria genera within different families in the proximal (A) and distal (B) colon of mice that received sham (Cec-) or cecectomy (Cec+) surgeries and were orally adminstered PBS (CR-) or Citrobacter rodentium (CR+) 14 days post-inoculation. Bars indicate the mean (n = four mice/treatment).
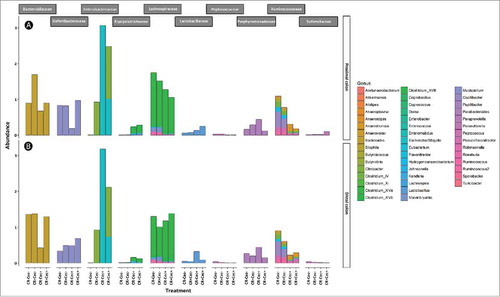
Figure 6. Relative abundance of genera within the Lachnospiraceae family in the proximal (A) and distal (B) colon of mice that received sham (Cec-) or cecectomy (Cec+) surgeries and were orally administered PBS (CR-) or Citrobacter rodentium (CR+) 14 days post-inoculation. Data represents the mean (n = four mice/treatment).
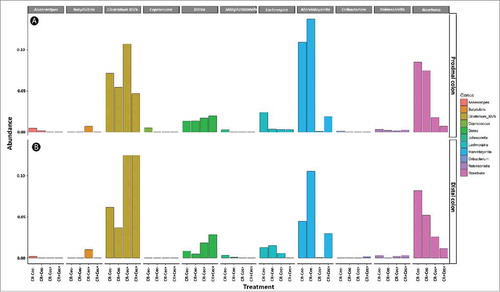
Figure 7. Relative abundance of genera within the Ruminococcaceae family in the proximal (A) and distal (B) colon of mice that received sham (Cec -) or cecectomy (Cec+) surgeries and were orally administered PBS (CR-) or Citrobacter rodentium (CR+) 14 days post-inoculation. Data represents the mean (n = four mice/treatment).
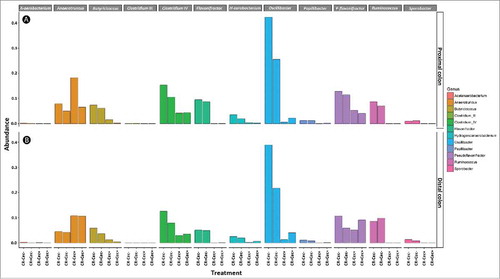
Figure 8. (A) Densities of viable C. rodentium (log CFU/g) in feces as determined by dilution plating for mice that received sham (Cec -) or cecectomy (Cec +) surgeries, were orally administered Citrobacter rodentium (CR+), and received enemas containing PBS (But-) or butyrate (But+). Vertical lines associated with markers indicate standard error of the means (n = four mice/treatment). (B-E) Visualization of C. rodentium in distal colon tissues at peak infection (i.e. 7 days post-inoculation); (B) Cec- and But-; (C) Cec- and But+; (D) Cec+ and But-; (E) Cec+ and But+. Cell nuclei are stained with DAPI (blue), total bacteria are stained with Alexa-488 (green) and γ-Proteobacteria (C. rodentium) are stained with Alexa-594 (red). Scale bar = 50 µm.
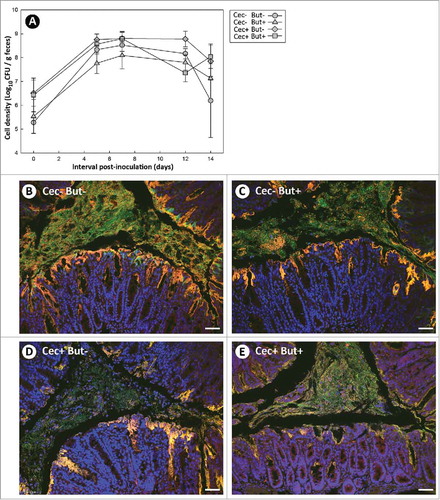
Figure 9. (A) Temporal change in body weight, and (B) change in body weight at 13 days after administration of Citrobacter rodentium or PBS. Mice that received sham (Cec-) or cecectomy (Cec+) surgeries, were orally administered PBS (CR-) or C. rodentium (CR+), and received enemas containing PBS (But-) or butyrate (But+). Vertical lines associated with markers or histogram bars represent standard error of the means (n = three to five mice/treatment). *P ≤ 0.050.
Figure 10. Histopathological scores of spleen tissues from mice that received sham (Cec-) or cecectomy (Cec+) surgeries, were orally administered PBS (CR-) or Citrobacter rodentium (CR+), and received enemas containing PBS (But-) or butyrate (But+). Data is shown 7 and 14 days after administration of C. rodentium or PBS. Vertical lines associated with histogram bars represent standard error of the means (n = three to five mice/treatment). *P ≤ 0.050, **P ≤ 0.010. The maximum possible score is 12.
Figure 11. Histopathological scores of tissue sections from the (A) proximal and (B) distal colon of mice that received sham (Cec-) or cecectomy (Cec+) surgeries, were orally administered PBS (CR-) or Citrobacter rodentium (CR+), and received enemas containing PBS (But-) or butyrate (But+). Data is shown 7 and 14 days after administration of C. rodentium or PBS. Vertical lines associated with histogram bars represent standard error of the means (n = three to five mice/treatment). *P ≤ 0.050, **P ≤ 0.010.
Figure 12. Expression of mRNA transcripts which code for: (A) Ifnγ; (B) Tnfα; (C) Il17a; (D) Il10; (E) Tgfβ; (F) Relmβ; (G) Muc2; (H) βd1; (I) Ffar2; and (J) Ffar3 in proximal colonic tissues of mice that received sham (Cec-) or cecectomy (Cec+) surgeries, were orally administered PBS (CR-) or Citrobacter rodentium (CR+), and received enemas containing PBS (But-) or butyrate (But+). Data is shown 7 and 14 days after administration of C. rodentium or PBS (p.i.). Vertical lines associated with histogram bars represent standard error of the means (n = three to five mice/treatment). *P ≤ 0.050, **P ≤ 0.010.
Figure 13. Expression of mRNA transcripts which code for: (A) Ifnγ; (B) Tnfα; (C) Il17a; (D) Il10; (E) Tgfβ; (F) Relmβ; (G) Muc2; (H) βd1; (I) Ffar2; and (J) Ffar3 in distal colonic tissues of mice that received sham (Cec-) or cecectomy (Cec+) surgeries, were orally administered PBS (CR-) or Citrobacter rodentium (CR+), and received enemas containing PBS (But-) or butyrate (But+). Data is shown 7 and 14 days after administration of C. rodentium or PBS (p.i.). Vertical lines associated with histogram bars represent standard error of the means (n = three to five mice/treatment). *P ≤ 0.050, **P ≤ 0.010, ***P ≤ 0.001.