Figures & data
Figure 1. Mitigation of proinflammation by P. UF1 during L. m infection. C57BL/6 mice were gavaged with P. UF1 (green) or with ΔdlaT P. UF1 (blue) (109 CFU/mouse) four times (4x) on days -7, -4, -1 and 2. Mice were orally infected on day 0 with L. m (109 CFU). Splenic immune responses were analyzed on day 7. (A) Representative data of flow plots, percentage (%), and total cell counts of IL-1β+, IL-6+ and IL-12/23p40+ DCs. (B) Representative data of flow plots, percentage (%), and total cell counts of colonic Th17 cells, Th1 cells, Treg and IL-10+ TGF-β+ FoxP3+ Tregs. A: Representative of three independent experiments (n = 5 mice/group). B: Combined data of two independent experiments (n = 4–9 mice/group). The p value was determined by ANOVA plus Tukey's post-test or Kruskal-Wallis plus Dunn's post-test. Data are represented as mean ± S.E.M; *p < 0.05, **p < 0.01, ***p < 0.01.
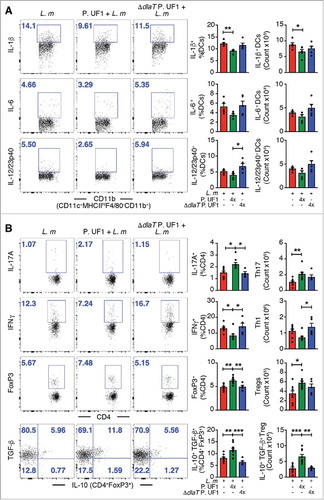
Figure 2. Analyses of microbiota during L. m infection in C57BL/6 mice. C57BL/6 mice were gavaged with PBS (red), P. UF1 (green), or with ΔdlaT P. UF1 (blue) (109 CFU/mouse) four times (4x) on days -7, -4, -1 and 2. Mice were orally infected on day 0 with L. m (109 CFU). One group of mice was left uninfected (PBS, black). Feces were collected on day 7 and microbiota analyzed. (A) Summary box-plots of Chao Richness, Shannon diversity, and Pielou evenness indices derived from results of 16S microbiota analyses. L. m (red); P. UF1 + L. m (green); ΔdlaT P. UF1 + L. m (blue); and PBS (black). (B) Mean total microbiota phyla composition of L. m, P. UF1 + L. m, ΔdlaT P. UF1 + L. m, and PBS. (C) Taxonomic cladogram demonstrating taxonomic differences among mouse groups as indicated. (D) Effect size of the most differentially abundant taxons shown in graph C. A-D: Combined data from two independent experiments (A-D, n = 7–8 mice/group)
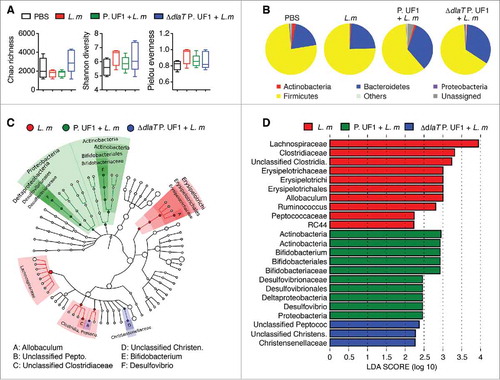
Figure 3. Mitigation of proinflammation by P. UF1 during L. m expressing 3 DlaT peptides (L. m3pep) infection. C57BL/6 mice were orally infected with 109 CFU of L. m (red) or with L. m3pep (grey). Seven days post-infection, splenic immune responses were analyzed. (A) Representative data of flow plots, percentage (%), and total cell counts of IL-1β+, IL-6+ and IL-12/23p40+ DCs. (B) Representative data of flow plots, percentage (%), and total cell counts of colonic Th17 cells, Th1 cells, Treg cells and IL-10+ TGF-β+ FoxP3+ Tregs. A and B: Representative data from two independent experiments (n = 4 mice/group). The p value in A and B was determined by a two-tailed unpaired t-test. Data are represented as mean ± S.E.M; *p < 0.05, **p < 0.01.
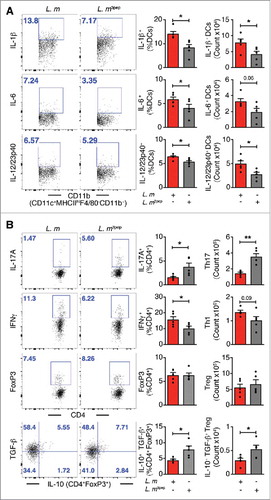
Figure 4. Clearance of L. m in the gut and liver of mice treated with P. UF1. C57BL/6 (open bar) or Signr1−/− (dashed bars) were gavaged with PBS (red), P. UF1 (green), or with ΔdlaT P. UF1 (blue) (109 CFU/mouse) four times (4x) on days -7, -4, -1 and 2. Mice were orally infected on day 0 with L. m (109 CFU). One group of mice were infected on day 0 with 109 CF L. m3pep (grey). (A and C) CFU of L. m recovered from the fecal samples collected 5 days after infection in C57BL/6 mice (A) or Signr1−/− (C) mice. (B and D) CFU of L. m recovered from the liver collected 7 days after infection in C57BL/6 mice (B) or Signr1−/− (D) mice. Representative data from two independent experiments (n = 4 mice/group in B and D or n = 5 mice/group in A and C). The p value was determined by ANOVA plus Tukey's post-test. Data are represented as mean ± S.E.M; * p < 0.05, ** p < 0.01, *** p < 0.01.
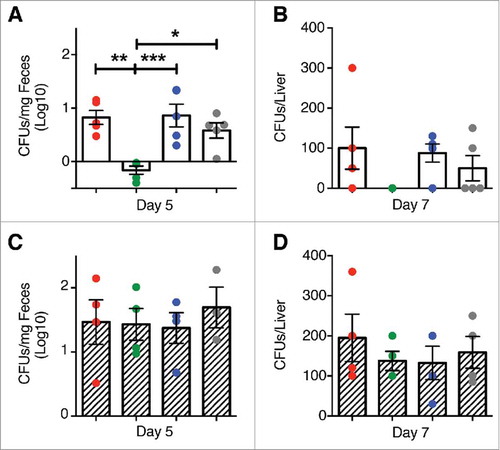
Figure 5. Mitigation of proinflammation by P. UF1 during L. m infection. Signr1−/- mice were gavaged with P. UF1 (green), or with ΔdlaT P. UF1 (blue) (109 CFU/mouse) four times (4x) on days -7, -4, -1 and 2. Mice were orally infected on day 0 with L. m (109 CFU). Splenic immune responses were analyzed on day 7. (A) Representative data of flow plots, percentage (%), and total cell counts of IL-1β+, IL-6+ and IL-12/23p40+ DCs. (B) Representative data of flow plots, percentage (%), and total cell counts of colonic Th17 cells, Th1 cells, Treg and IL-10+ TGF-β+ FoxP3+ Tregs. A and B: Representative of two independent experiments. The p value was determined by ANOVA plus Tukey's post-test. Data are represented as mean ± S.E.M.
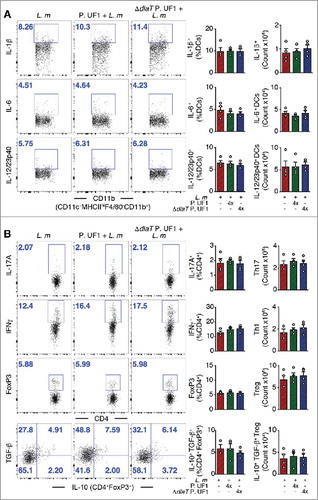
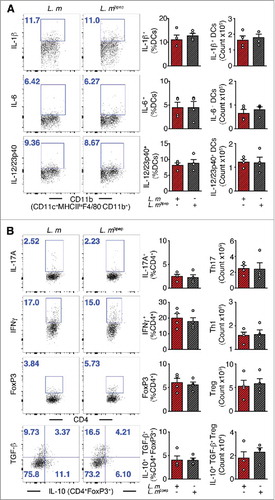
Figure 6. Mitigation of proinflammation by P. UF1 during L. m expressing 3 DlaT peptides (L. m3pep) infection. Signr1−/- mice were orally infected with 109 CFU of L. m (red) or with L. m3pep (grey). Seven days post-infection, splenic immune responses were analyzed. (A) Representative data of flow plots, percentage (%), and total cell counts of IL-1β+, IL-6+ and IL-12/23p40+ DCs. (B) Representative data of flow plots, percentage (%), and total cell counts of colonic Th17 cells, Th1 cells, Treg cells and IL-10+ TGF-β+ FoxP3+ Tregs. A and B: Representative data from two independent experiments (n = 4 mice/group). The p value in A and B was determined by a two-tailed unpaired t-test. Data are represented as mean ± S.E.M.