
Figures & data
Figure 1. Effect of FMT for rCDI upon bile acid profiles.
A significant decrease in chenodeoxycholic acid (A) and cholic acid (B) is seen between screening and 4 weeks, and maintained up to 12 weeks post-FMT. A significant increase in lithocholic acid (C) and deoxycholic acid (D) is observed between screening and 4 weeks, and maintained up to 12 weeks post-FMT. X-axis depicts time, and y-axis depicts relative intensity of each bile acid. Pre-FMT = screening; week 4 = 4 weeks after fecal microbiota transplantation (FMT); week 12 = 12 weeks post-FMT.
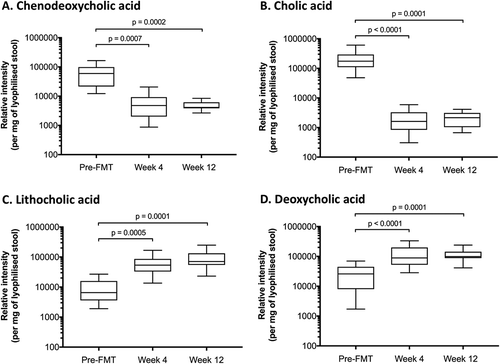
Figure 2. Normalized Protein eXpression (NPX) values for serum fibroblast growth factor (FGF)19 (A) and FGF21 (B) over time.
There is a statistically significant increase in FGF19 level 4 and 12 weeks after FMT compared to screening, while a statistically significant decrease in FGF21 level is observed 4 and 12 weeks following FMT. X-axis depicts time, and y-axis depicts relative quantification of respective FGF. Circles represent mean; error bars represent standard deviation.
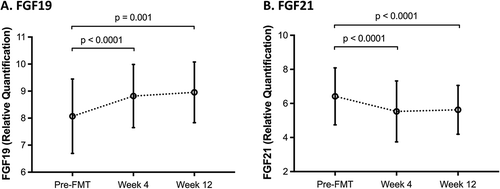
Table 1. Comparison of the mean body mass index (BMI) over time. At week 4, the mean BMI was not significantly different from the mean BMI prior to FMT. At week 12, patients had significantly higher BMI relative to pre-FMT, but did not exceed pre-rCDI baseline.
Table 2. Patient baseline characteristics.