Figures & data
Table 1. Dysbiosis index and alpha diversity results for cats that received clindamycin and placebo or synbiotic.
Figure 1. Principal coordinate analysis (PCoA) of unweighted uniFrac distances of 16S rRNA genes.
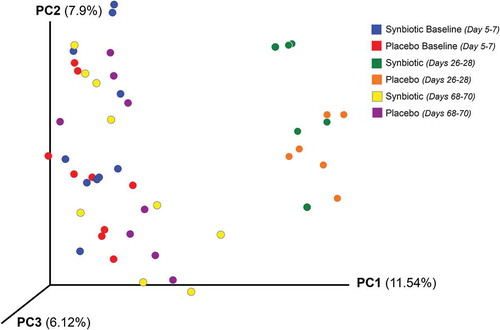
Figure 2. Phylum- and class-level composition of fecal microbiota obtained from feline fecal samples.
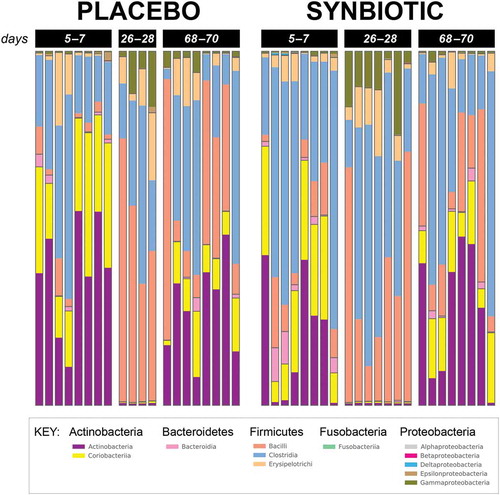
Figure 3. Dual hierarchical dendrogram of metabolites, clustered by pathway, that differed significantly over time in feline fecal samples.
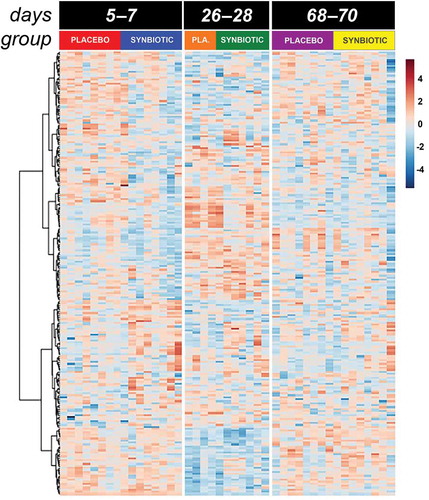
Figure 4. Principal component analysis (PCA) of metabolic pathway analyses from feline fecal samples.
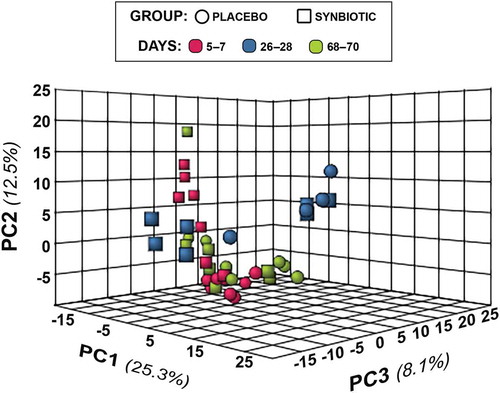
Figure 5. Box and whisker plots of fecal metabolite profiles for selected fecal metabolites that differed significantly (fdr - adjusted P < 0.05) between treatment groups and over time. Figure 5a:
Figure 5b. (Continued).
Figure 5c. (Continued).
Table 2. Metabolites of known biological import with fecal profiles that significantly differed by group by time interaction, group, and/or time.
Table 3. Metabolic pathways that differed significantly over time.
Figure 6. Study design, duration, observations, and sampling flowchart.