Figures & data
Figure 1. Microbiomes of mice with IBD induce more severe gut inflammation in recipient GF Smad3-/- mice compared to microbiomes of mice without IBD. GF Smad3-/- mice were colonized with microbiomes of mice with and without IBD. IBD was induced in donors by H. bilis infection, and the healthy microbiome was obtained from Smad3-/- SPF colony mice housed in a facility that excludes Helicobacter. Two days following the colonization, ceca and colons were scored for inflammation by histological analysis. (a) IBD scores of colon and cecum, (b) cecum, and (c) colon are shown. Possible score ranges for each tissue type are indicated on the Y-axis labels. (d) Cecum from a GF Smad3-/- mouse colonized with microbiomes from donors without IBD shows marked submucosal edema with diffuse inflammation and attenuation of the mucosa that, although pronounced, is less severe compared to cecum from a GF Smad3-/- mouse colonized with microbiome of donors with IBD (e), in which there is marked mucosal congestion and more extensive mucosal ulceration. In the proximal colon, a mouse colonized with microbiome from donors without IBD (f) shows only minimal to mild inflammation, with more extensive and severe inflammation in a mouse colonized with microbiome of donors with IBD (G).
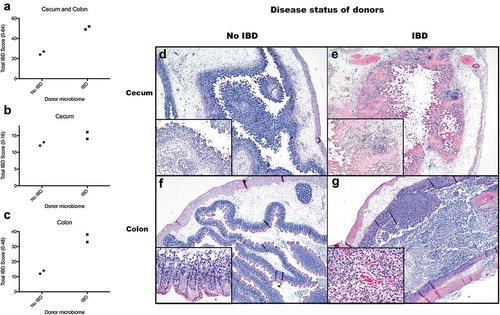
Figure 2. Microbiomes of mice with acute IBD or in remission from IBD induce more severe IBD in GF Smad3+/- mice compared to microbiomes of healthy mice. GF Smad3+/- mice were colonized with microbiomes of mice with acute IBD, in remission, and without IBD for 6 days. IBD was scored in the colon and cecum of individual mice by histological analysis. (a) Representative pictures of the cecum and colon of recipient mice that were colonized with microbiomes of mice without disease, with acute IBD or in remission. IBD scores of (b) cecum and (c) colon are shown. Possible score ranges for each tissue type are indicated on the Y-axis labels. (d) Representative histological images are shown of the cecum, proximal colon and mid colon for each colonization group. All mice have severe inflammation with regionally extensive severe mucosal ulceration in the cecum, although the mice colonized with acute IBD microbiomes have marked necrotic material expanding the lumen of the cecum (asterisk). In the proximal and mid colon, mice colonized with healthy microbiomes (no IBD) have minimal inflammation, whereas mice colonized with acute and remission IBD microbiomes have moderate diffuse inflammation. Horizontal bars represent mean ± SEM. One-way ANOVA test was performed followed by a post-hoc test of pair-wise comparisons with Bonferroni’s multiple comparison adjustment. **, p < 0.01.
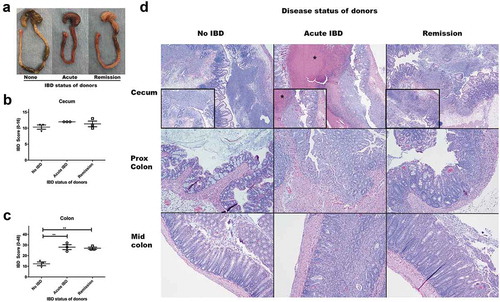
Figure 3. H. bilis is not a cause of IBD and prevents severe IBD in GF mice. GF Smad3+/- mice were mono-colonized with H. bilis, and the severity of inflammation was determined 7, 10 and 21 days post colonization by histological analysis of ceca and colons (a-c). IBD scores of cecum and colon (a), cecum (b), and colon (c) are shown. Possible score ranges for each tissue type are indicated on the Y-axis labels. GF Smad3+/- mice were colonized with microbiomes of mice with IBD, with or without prior H. bilis mono-colonization. The severity of IBD was determined 1 week and 4 weeks post fecal colonization by histological analysis of ceca and colons (d-f). IBD scores of cecum and colon (d), cecum (e), and colon (f) are shown. Horizontal bars represent mean ± SEM. One-way ANOVA test was performed followed by a post-hoc test of pair-wise comparisons with Bonferroni’s multiple comparison adjustment (a-c). Unpaired t-test was used for comparisons between the groups with and without mono-colonization prior to fecal transfer (D-F). *, p < 0.05; **, p < 0.01.
Figure 4. Microbiomes of mice with IBD induce inflammation in GF recipients in a manner dependent on the genetic background of recipient GF mice. Microbiomes of mice with or without IBD were transferred to GF C57BL/6, 129 and Swiss Webster mice, and the severity of IBD was determined 6 days post fecal transfer by histological analysis. IBD scores of cecum and colon (a), cecum (b), and colon (c) are shown. One-way ANOVA was performed followed by a post-hoc test of pair-wise comparisons with Bonferroni’s multiple comparison adjustment. *, p < 0.05; **, p < 0.01.