Figures & data
Figure 1. Comparative weight gain and loss in mice across different groups. Mice groups were assigned with the following manner: (a) ST infection, (b) ST infection and LC 1-week pretreatment, (c) ST infection and LC+mcra 1-week pretreatment, (d) EHEC infection, (e) EHEC infection and LC 1-week pretreatment, and (f) EHEC infection and LC+mcra 1-week pretreatment. Each dot indicates individual mouse weight and horizontal bars at each time point indicate averaged weight of mice in accordant group.
Figure 2. Kaplan-Meier survival curve for ST-infected mice only, or mice pretreated with wild-type probiotic strain LC or bioactive probiotic strain LC+mcra before ST-infection. Survival probability plotted over time and compared at significant level of 0.05 (*) or 0.01 (**) by Log-Rank test.
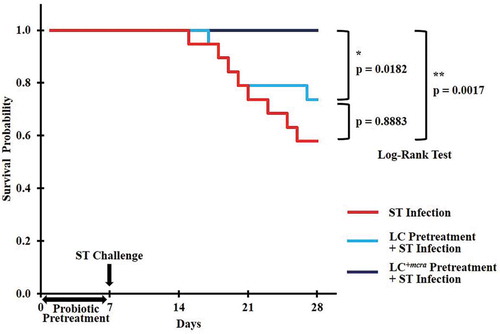
Figure 3. Effect of LC+mcra on reducing colonization of ST in mice gut intestine. The bacterial numbers of ST at 14, 21, and 28 days in cecum (a), jejunum (b), ileum (c), and feces (d) from ST-infected mice with no probiotic treatment, LC, or LC+mcra 1-week pretreatment were investigated in triplicate. Different letters (‘a’ through ‘c’) at individual time point (day 14, 21, or 28) are significantly different (p < 0.05) in the numbers of ST among control, LC pretreatment, and LC+mcra pretreatment.
Figure 4. Effect of LC+mcra on reducing colonization of EHEC in mice gut intestine. The bacterial numbers of EHEC at 14, 21, and 28 days in cecum (a), jejunum (b), ileum (c), and feces (d) from EHEC-infected mice with no probiotic treatment, LC, or LC+mcra pretreatment were investigated in triplicate. Different letters (‘a’ through ‘c’) at individual time point (day 14, 21, or 28) are significantly different (p < 0.05) in the numbers of EHEC among control, LC pretreatment, and LC+mcra pretreatment.
Figure 5. Comparison on colonization levels of LC and LC+mcra in mice gut intestine. The bacterial numbers of specific L. casei at 14, 21, and 28 days in cecum (A), jejunum (B), ileum (C), and feces (D) from mice daily administered with LC or LC+mcra for one week were investigated in triplicate. Asterisk (*) at day 14, 21, or 28 are significantly different (p < 0.05) in the numbers of gut colonized or fecal shedding wild-type LC and LC+mcra.
Table 1. Mice groups, numbers per group, and their treatment/infection.
Table 2. Primers used for qRT-PCR analysis of mice intestinal cytokine gene expressions.
Table 3. Hematological changes and comparison of mice with and without Salmonella infection.
Table 4. White blood cell counts in mice with and without Salmonella infection.
Figure 6. Mice cecum histopathology. Representative H&E-stained cecum sections from experimental groups were showed in panels (a) control mice, (b) intestinal villi and microvilli reduction in ST-infected mice with 1-week LC pretreatment, (c) normal intestinal histology in ST-infected mice with 1-week LC+mcra pretreatment, (d) moderate depletion of goblet cells and villi/microvilli in ST-infected mice, (e) massive elimination of goblet cells and villi/microvilli in ST-infected mice, (f) intestinal inflammation and infiltration at circular folds in ST-infected mice. All images were captured under 100 × .
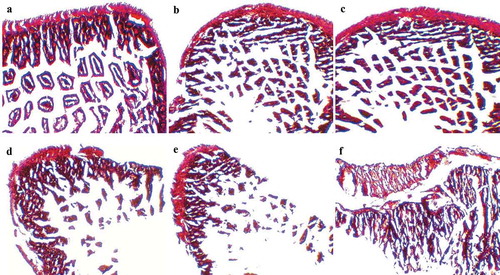
Figure 7. Differential expression levels of mice cecal cytokine genes. The relative log fold changes in expression of IL-1β (a), IL-6 (b), IL-10 (c), INF-γ (d), TGF-β (e), and TNF-α (f) genes from cecum tissue cells collected from control mice, mice under ST infection, mice pretreated with wild-type LC and challenged with ST, or mice pretreated with LC+mcra and challenged with ST were examined in triplicate. Different letters (‘a’ through ‘d’) at individual time point (day 14, 21, or 28) are significantly different (p < 0.05) among groups of control, infection, and infection following probiotic pretreatments.
Figure 8. Mice cecal microbial community phylum-level structure. Bacterial distributions at phylum level in cecal contents from individual pooled dataset were depicted in terms of (a) control mice providing placebo and without ST infection, (b) mice infected with ST, (c) mice daily administered with LC for one week followed by ST challenge, and (d) mice daily administered with LC+mcra for one week followed by ST challenge.
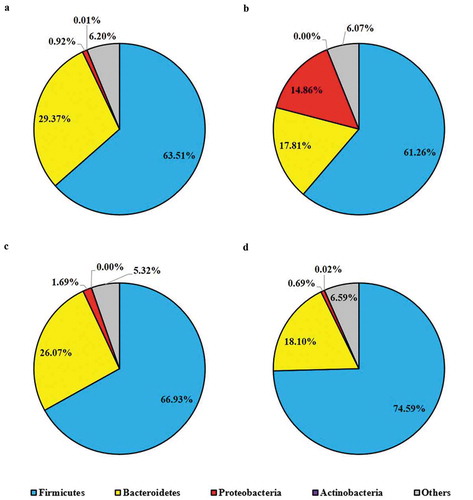
Figure 9. Mice cecal microbiota composition at genus level. Bacterial genus-level community composition in cecal contents from consolidated pool of dataset was compared among control mice providing placebo and without ST infection, mice infected with ST, mice daily administered with LC for one week followed by ST challenge, and mice daily administered with LC+mcra for one week followed by ST challenge. Overall 30 bacterial genera were targeted based on their relative abundances and importance in gut microbiome. The total relative abundances of all targeted 30 genera varied from 43 to 46% in different mice groups.
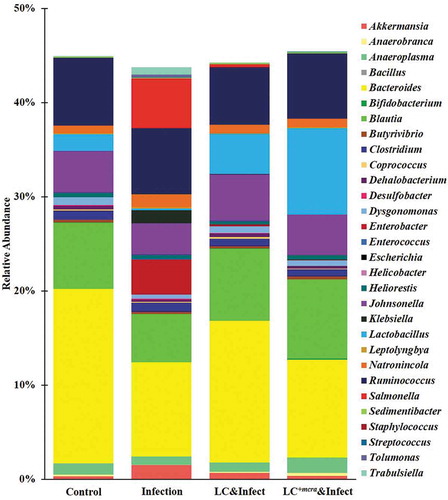
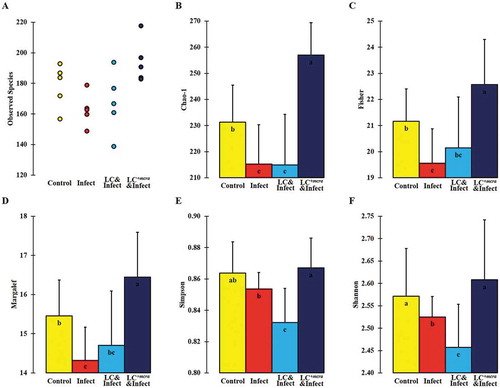
Figure 10. Bacterial diversity at species level in murine cecum. The assessment of alpha-diversity including Observed number of taxa species (A), Chao-1 (B), Fisher’s alpha (C), Margalef’s richness (D), Simpson index (E), and Shannon index (F) was determined and analyzed among control mice providing placebo and without ST infection, mice infected with ST, mice daily administered with LC for one week followed by ST challenge, and mice daily administered with LC+mcra for one week followed by ST challenge. Standard deviations among individual group members were provided. Different letters (‘a’ through ‘c’) are significantly different (p < 0.05) among groups of control, infection, and infection following probiotic pretreatments.