Figures & data
Figure 1. Clinical response to diet intervention in sugar malabsorbing IBS patients. (A) Flow diagram illustrating the study phases. (B) VAS scores and 95% CI bars displayed at baseline (BL) for participants with malabsorptions/intervention cohort (Intv) and controls (Ctrl) and during elimination (EL) and tolerance (TO) phase. (C) Left, VAS scores across study phases in diet responder (Resp, n = 12) vs. non-responder (NR, n = 10), 95% CI bars. Right, scatter plot of individual VAS scores at the end of TO phase in responder vs non-responder. (D) Median levels (+ IQR) of energy intake and diet components over time in the intervention cohort. (E) Distribution of responder vs. non-responder as percentage for individual or combined sugar malabsorptions. (F) Median intake of lactose, fructose or sorbitol with 95% CI bars at baseline, during EL and TO in patients with single or combined malabsorptions for the respective sugar presented as responder vs. non-responder (lactose: n = 3 (Resp)/4 (NR); fructose: n = 3 (Resp)/4 (NR); sorbitol: n = 10 (Resp)/9 (NR)). Data are presented as medians. *** p < .001 vs. BL (Wilcoxon matched-pairs rank test), # p < .01 (Mann–Whitney test).
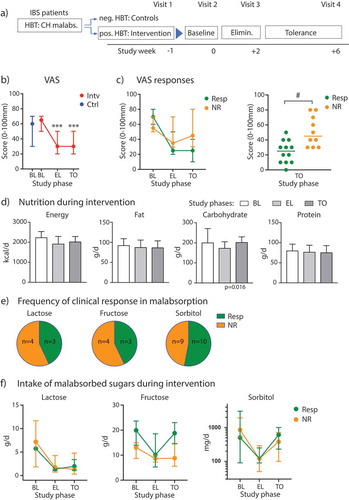
Table 1. Summary of IBS symptoms and nutrition over the course of the study in the intervention cohort.
Figure 2. Fecal microbiome analyzes by 16S rRNA amplicon sequencing. (A) Alpha-diversity levels shown as Simpson’s index in control participants and patients of the intervention group (split into Resp vs. NR) during different study periods. (B) Relative abundances of bacterial families in study participants. (C) Non-metric multidimensional-scaling (NMDS) plot of fecal microbiota beta-diversity indices (generalized UniFrac distances) from Resp vs NR at TO; p-value obtained by PERMANOVA.
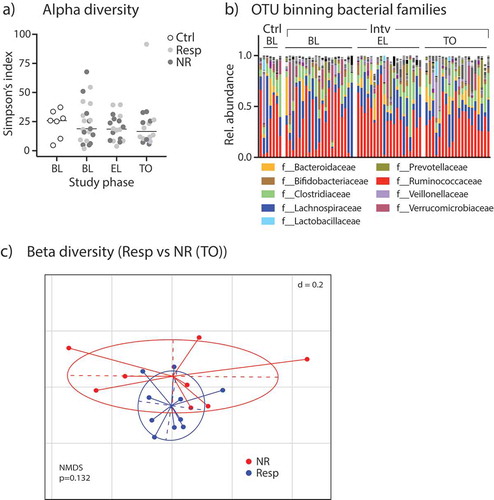
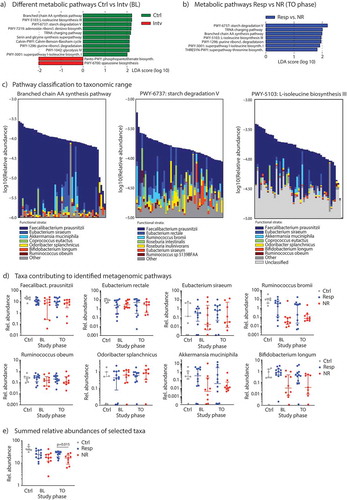
Figure 3. Metagenome sequencing of the gut microbiota to reveal metabolic pathways and taxa. (A) LEfSe analyzes to determine the most differentially abundant metabolic pathways between controls vs. subjects from the diet intervention group at baseline, and (B) to detect metabolic pathways significantly enriched in responder subjects (Resp) at TO study phase. (C) Relative contribution of individual bacterial species in an individual sample to either the branched chain amino acid (AA) synthesis pathway (left), the starch degradation pathway (middle) or the L-isoleucine biosynthesis pathway III (right), all samples (n = 51) included in this analysis. (D) Relative abundances (in %) of specific species associated with microbial metabolic pathways from Figure 3C in control subjects and responder vs. non-responder patients across the study period determined by shotgun-metagenome sequencing and Metaphlan2 analysis. (E) Sum of relative abundances of species from Figure 3D for each group. Data are presented as medians with interquartile ranges.