Figures & data
Figure 1. Fn promoted CRC cells migration and metastasis. (a) The abundance of Fn in the feces of CRC patients (T, n = 49) versus healthy people (N, n = 30).The abundance of Fn is higher in the feces of CRC patients with lymph nodes metastasis (N1+ N2, n = 23) than those without metastasis (N0, n = 26). (b,c) HCT-116 and LoVo cells were incubated with PBS control, E. coli or Fn. The migration ability of cells was evaluated by transwell assay (b) or wound healing assay (c). In transwell assay, migrated cells were stained with DAPI and images were randomly taken under microscope. Every 6 fields were counted for each sample. (d) HCT-116 cells were incubated with Fn or PBS for 24 h and then injected into BALB/C nude mice via tail vein (n = 6 per group). The left panel shows macroscopic lungs of nude mice. The area of metastatic lesions was labeled by dashed circles. The middle panel indicates the hematoxylin-eosin (H&E) staining of lung metastasis (scale bar = 100 μm), two representative images per group. The right panel shows the statistical analysis of metastasis focuses. (e) Fn in lung metastasis tissues was detected by FISH. The colonization of Fn was detected in lung metastasis from mice injected with Fn-treated cells (1000 times magnification power). The white arrows indicate positive stain. All data are shown as mean ± SD, *p < .05, **p < .01, ***p < .001, ****p < .0001 (Mann–Whitney test was used in a, unpaired Student’s t test was used in b and d). Ctrl, control; E.coli, Escherichia coli; Fn, Fusobacterium nucleatum.
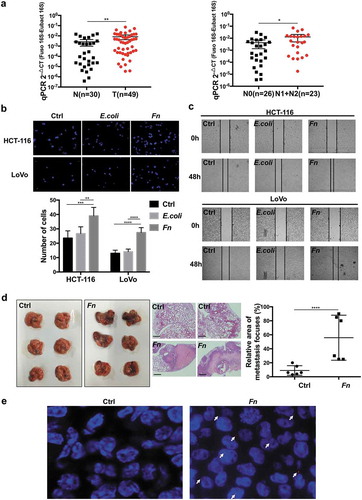
Figure 2. KRT7-AS/KRT7 expression is upregulated in Fn-treated CRC cells. (a) Heatmap of representative differentially expressed LncRNA between Fn-treated and PBS-treated LoVo cells (n = 3 per group, fold change>2, logCPM>2, FDR<0.05). (b) The schematic representation of KRT7-AS (ensemble gene transcript ENST00000546688, on the negative DNA strand) and KRT7 mRNA (ReSeq gene NM_005556, on the positive strand). E7 indicates seventh exon of KRT7 gene. Black arrows indicates transcription direction. “+” indicates the positive strand. “-” indicates the negative strand. (c) Heatmap of representative differentially expressed mRNA between Fn-treated and PBS-treated cells (n = 3 each, fold change>2, logCPM>2, FDR <0.05). (d) HCT-116 or LoVo were incubated with live or heat-killed Fn, E.coli or PBS for 24 h. The RNA expression level of KRT7-AS and KRT7 were analyzed by qRT-PCR. (d) HCT-116 cells were incubated with Fn in different multiplicity of infection (MOI) (10:1, 50:1, 100:1, 200:1) for 24 h and the expression level of KRT7-AS and KRT7 were analyzed by qRT-PCR. (f) HCT-116 or LoVo were incubated with live or heat-killed Fn, E.coli or PBS for 24 h. KRT7 protein was analyzed by Western blot. (g) HCT-116 were incubated with Fn or PBS for 24 h, immunofluorescence assay was conducted to show KRT7 protein in HCT-116 cells (scale bar = 50 μm). All data are shown as mean ± SD, **** p < .0001 (unpaired Student’s t test). Ctrl, control; Fn, Fusobacterium nucleatum.
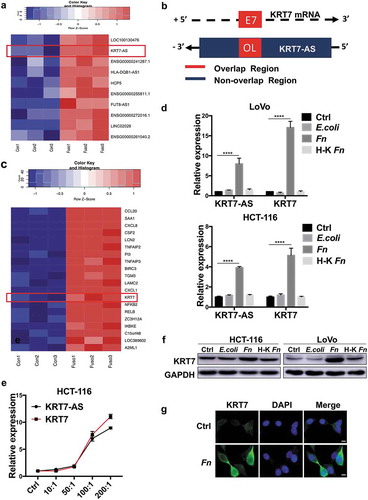
Figure 3. KRT7-AS promoted metastasis of CRC cells by regulating KRT7. (a) RNA level of KRT7-AS and KRT7 was detected by qRT-PCR after knockdown of KRT7-AS (upper left panel) or overexpression of KRT7-AS (upper right panel), respectively, in HCT-116 cells. Expression level of KRT7-AS and KRT7 were detected by qRT-PCR after knockdown of KRT7 (lower left panel) or overexpression of KRT7 (lower right panel), respectively, in HCT-116 cells. (b) KRT7 protein level was detected by Western blot after knockdown or overexpression of KRT7-AS or KRT7. (c, d) HCT-116 cells were transfected with siRNA targeting KRT7-AS (KRT7) or KRT7-AS (KRT7) plasmids. Wound healing assays (c) and transwell assays (d) were performed. For transwell assay, migrated cells were stained with DAPI and images were randomly taken under microscope. Every 6 fields were counted for each sample. (e) HCT-116 cells stably transfected with KRT7-AS shRNA lentivirus were established and injected into nude mice via tail vein. The number of metastatic nodules in each slide was counted after H&E staining. (n = 8 mice per group). GFP signal shows metastatic cells infected by lentivirus in lungs. (f) HCT-116 cells were transfected with shKRT7-AS lentivirus alone or combined with KRT7 overexpression plasmid, and transwell assay was performed. Migrated cells were stained with DAPI and images were randomly taken under microscope. Every 6 fields were counted for each sample. All data are shown as mean ± SD, *p < .05, **p < .01, ***p < .001, ****p < .0001 (unpaired Student’s t test). NC, negative control; Fn, Fusobacterium nucleatum; vec, vector; si, siRNA.
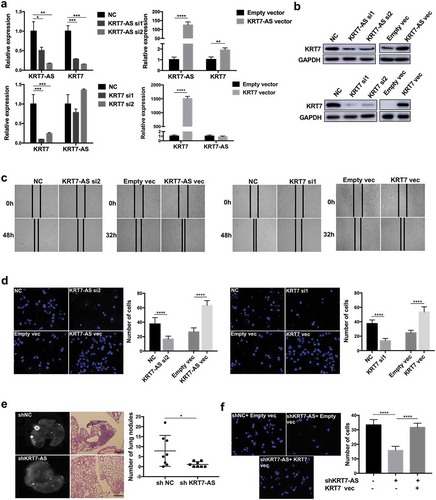
Figure 4. Fn promoted metastasis of CRC by modulating KRT7-AS/KRT7. (a,b) HCT-116 cells were transfected with siRNA targeting KRT7-AS and then incubated with Fn. qRT-PCR (a) and western blot (b) indicated that knockdown of KRT7-AS suppressed the Fn-induced upregulation of KRT7. (c) HCT-116 cells were transfected with siRNA targeting KRT7-AS or KRT7 and then incubated with Fn or PBS. Transwell assay was performed. Migrated cells were stained with DAPI and images were randomly taken under microscope. Every 6 fields were counted for each sample. (d) HCT-116 cells were stably transfected with KRT7-AS shRNA or control lentivirus and then incubated with Fn or PBS for 24 h. Then, above-prepared cells were injected into nude mice via tail vein (n = 8 each group). The number of metastatic nodules in lung was counted in each slide after H&E staining (scale bar = 100 μm). GFP signal shows metastatic HCT-116 cells infected by lentivirus in lungs. All data are shown as mean ± SD, *p < .05, **p < .01, ****p < .0001 (unpaired Student’s t-test). NC, negative control; Fn, Fusobacterium nucleatum; si, siRNA.
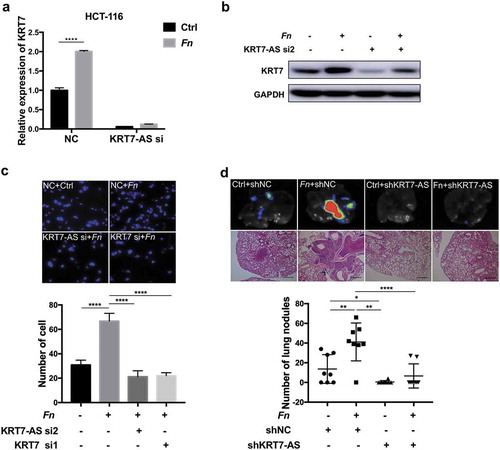
Figure 5. Fn regulated KRT7-AS through NF-κB signaling pathway. (a) The KEGG analysis based on RNA sequencing result shows activation of NF-κB induced by Fn infection. (b) HCT-116 or LoVo cells were incubated with live or heat-killed Fn, E.coli or PBS for 24 h. The protein level of phospho-p65, p65, and IκB-α was measured by Western blot. (c) HCT-116 or LoVo were incubated with Fn or PBS control for 2 h. Immunofluorescence assay was performed to detect the p65 in the nucleus. DAPI was used to stain cell nucleus (scale bar = 50 μm). (d) Western blot shows the efficiency of two siRNA targeting p65. (e) HCT116 or LoVo was transfected with siRNA targeting p65. After 48 h, the qRT-PCR was performed to analyze the expression of KRT7-AS. (f) HCT-116 cells were treated with BAY-117082 (Selleck, USA) in different concentrations (5 μM, 10 μM, 20 μM) for 2 h (upper panel). HCT-116 cells were treated with 20 μM BAY-117082 for 2 h followed by Fn incubation for 4 h (lower panel). The qRT-PCR was performed to analyze the expression of KRT7-AS. (g) HEK293T and HCT-116 cells were transfected with luciferase reporter plasmid along with p65 siRNA or negative control. After 48 h, the luciferase activity was measured. The transfection efficiency data were normalized by dividing the Firefly luciferase activities with that of Renilla luciferase. All data are shown as mean ± SD, *p < .05, **p < .01, ***p < .001, ****p < .0001 (unpaired Student’s t-test). Ctrl, control; NC, negative control. Fn, Fusobacterium nucleatum; si, siRNA.
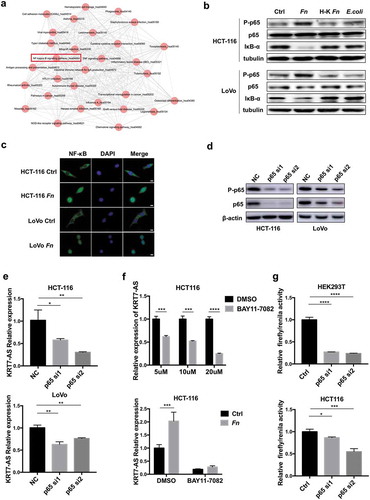
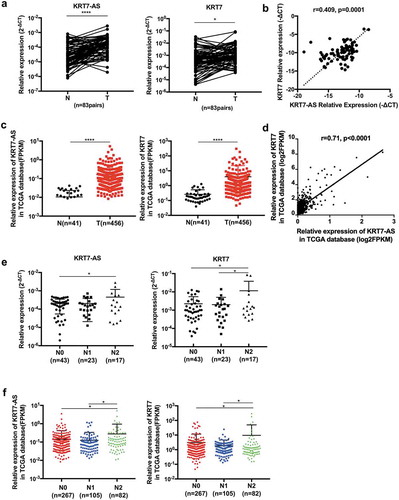
Figure 6. The expression of KRT7-AS/KRT7 in CRC patients. (a) The qRT-PCR analysis of the expression of KRT7-AS and KRT7 in CRC tissues and their adjacent normal tissues (n = 83 pairs). (b) Correlation analysis of the expression of KRT7-AS with KRT7 in our tested CRC tissues (n = 83, spearman r = 0.409, p < .0001). (c) Data in TCGA database showed the expression levels of KRT7-AS and KRT7 in colon cancer compared with those of normal controls (n = 456 vs.41). (d) Correlation analysis of the expression of KRT7-AS with KRT7 in TCGA database (n = 456, spearman r = 0.71, p < .0001). (e, f) The expression of KRT7-AS and KRT7 among CRC patients with different N stage (N0, N1, N2) in our tested CRC tissue (e) and TCGA database (f). All data are shown as mean ± SD, *p < .05, **p < .01, ***p < .001, ****p < .0001 (Wilcoxon matched-pairs signed-rank test was used in a, Mann–Whitney test was used in c, spearman correlation analysis was used in b and d, one-way ANOVA was used in e and f). Fn, Fusobacterium nucleatum.