Figures & data
Figure 1. Heat map of clustering based on the antimicrobial effect of each substrate, calculated as described in the Materials and Methods. Percent change in growth is indicated by color: red indicates less growth and blue indicates more growth compared to negative controls. Clusters are classified as bactericidal (red), antibacterial in most cases (yellow), antibacterial in some cases (green), and sometimes prebiotic (blue). Prebiotic compounds can only be digested and utilized by Bacteria, thereby facilitating their growth.
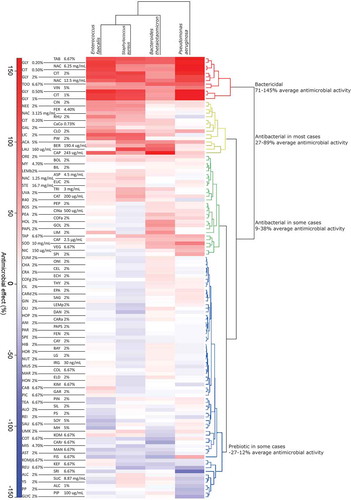
Table 1. Reagents and concentrations chosen for flow cytometry testing based on the growth curve and heat map results. Concentrations were conserved across species where possible but sometimes increased to improve prophage induction or decreased to reduce cytotoxicity. The value next to each concentration is the ratio of the maximum OD of the growth curve to the lowest OD measured after this peak. If the concentration was adjusted for flow cytometry, the initial concentration is provided. Ratios above the 1.19 cutoff are bolded.
Figure 2. (a) A comparison of the number of putative prophages found by Phispy and PHAST. (B) Putative prophage in bacterial genomes calculated with PHAST. Each prophage’s length, genomic position, and most closely related phage are listed in Supplementary Table S3.
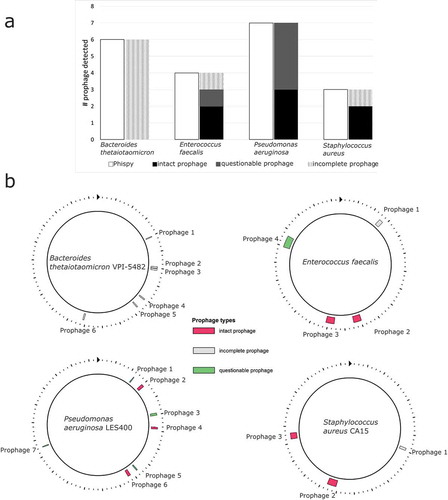
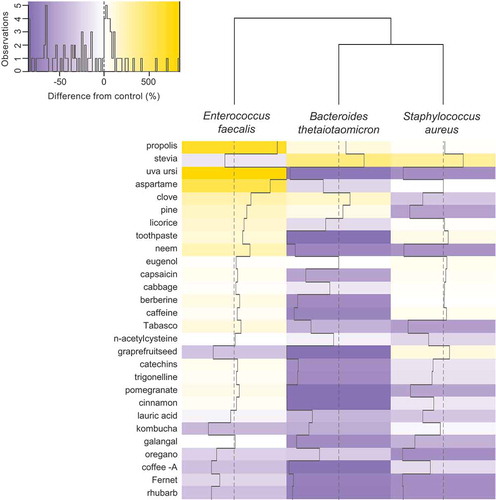
Figure 3. Induction of virus-like-particles (VLPs) by experimental compounds as detected by flow cytometry. VLPs were induced in B. thetaiotaomicron, E. faecalis, and S. aureus separately incubated with 28 compounds and the percent difference in abundances of VLPs were calculated relative to controls that lacked addition of any compound. Solid lines within cells represent deviations from 0 difference (dotted vertical line through columns).