Figures & data
Figure 1. Continuous cohousing accelerates GVHD in WT mice post-transplant.
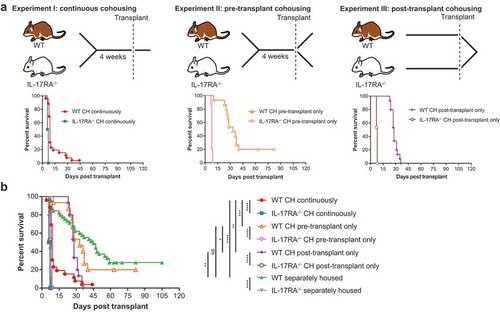
Figure 2. Species from the family Muribaculaceae are transferred during cohousing and are associated with disease susceptibility. (a) Heatmap displaying genomes identified as consistently significantly enriched or depleted in WT mice during pre-transplant cohousing across Experiments I and II (n = 4–5 per group per experiment). Complete analysis output and relative abundance values are contained in Table S6. (b) PCA displaying all pre-transplant mice across all three experiments, I, II and III, based on read mapping to a genome database composed of recovered MAGs plus genomes from NCBI (see methods). Dotted line indicates division between mice susceptible to early-onset (IL-17RA−/− and cohoused WT) and delayed-onset (separately housed WT) disease. Week 0 mice are pre-transplant mice from Experiment III and have undergone no cohousing pre-transplant. Week 4 mice have either been cohoused for 4 weeks or maintained separately for the same time period (control mice) and originate from Experiment I and II. (c) Heatmap displaying genomes with significantly different abundance between early-onset and delayed-onset GVHD susceptible mice, using division indicated in (b). Complete analysis output and relative abundance values are contained in Table S8. (d) Multivariate sparse partial least squares discriminant analysis (sPLS-DA) based on read mapping to genome database composed of recovered MAGs plus genomes from NCBI of all pre-transplant WT mice from Experiments I, II and III. (e) Genome-based signature contributing to separation along component 1 of (D). Color indicates group in which median genome abundance is highest. Bar length corresponds to loading weight. CH: cohoused, SH: separately housed.
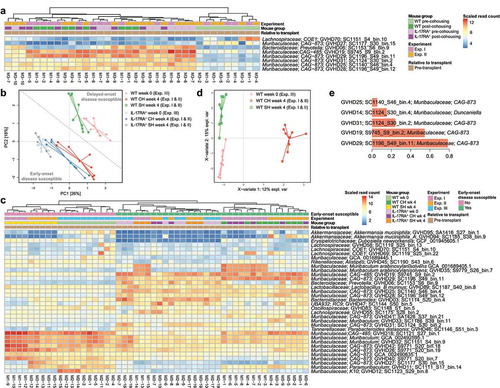
Figure 3. Increased abundance of Enterobacteriaceae is associated with disease. (a) Relative abundance of bacterial families Enterobacteriaceae, Acutalibacteraceae and Muribaculaceae across each experiment, before and after transplant. (b) Multivariate sparse partial least squares discriminant analysis (sPLS-DA) based on read mapping to genome database composed of recovered MAGs plus genomes from NCBI (see methods) of post-transplant WT mice. (c) Genome-based signature contributing to component 1 of (B). Genomes with frequency >0.75 across validation replicates displayed. Color indicates group in which median genome abundance is highest. Bar length corresponds to loading weight. CH: cohoused, SH: separately housed.
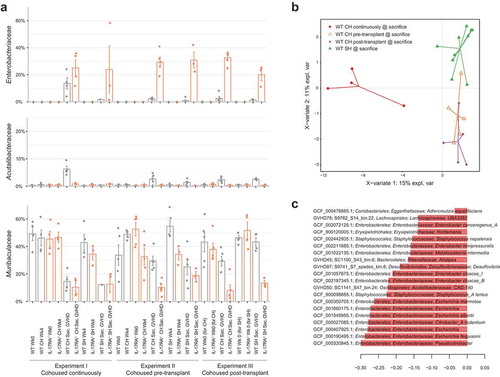
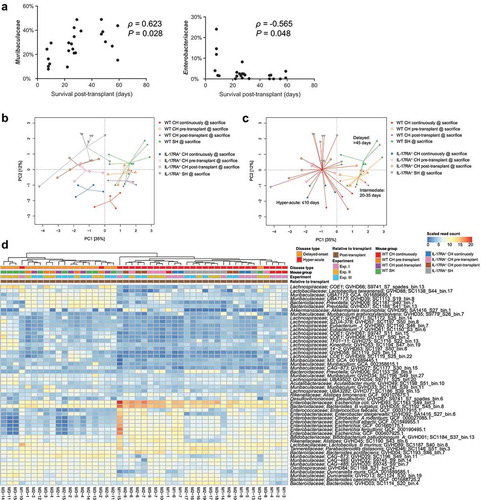
Figure 4. Length of survival post-transplant is associated with altered microbiome composition. (a) Correlation between relative abundance of Muribaculaceae and Enterobacteriaceae in WT mice at the time of sacrifice due to GVHD with length of survival post-transplant. Benjamini-Hochberg adjusted P values shown. (b) PCA displaying all mice sacrificed due to the development of GVHD across the three experiments (n = 4–5 per group per experiment) based on read mapping to genome database composed of recovered MAGs plus genomes from NCBI (see methods). (c) As per (B) with colored lines connecting mice within each survival timeframe. (d) Heatmap displaying genomes identified as significantly different between hyper-acute and delayed-onset GVHD at the time of sacrifice. Genomes with relative abundance >1% in at least one mouse displayed. Full list contained in Table S21. CH: cohoused, SH: separately housed.