Figures & data
Figure 1. Relative abundances in the gut microbiota at the phylum and genus levels. (a) Top ten phylum abundances in the gut microbiota from mission one. (b) Top ten genus abundances in the gut microbiota from mission one. (c) Top ten phylum abundances in the gut microbiota from mission two. (d) Top ten genus abundances in the gut microbiota from mission two.
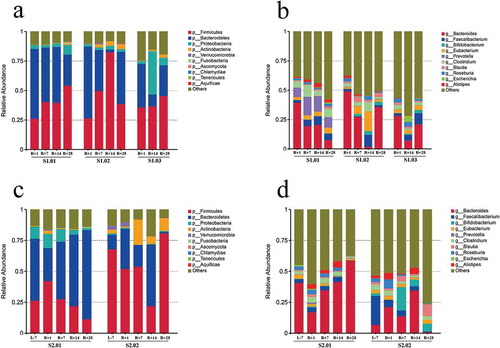
Figure 2. Comparison of α-diversity based on the Shannon index at the genus level and the species in the gut microbiota. (a) Comparison of α-diversity across four timepoints in mission one. (b) Comparison of α-diversity across five timepoints in mission two. (c) Distribution diagram of the LDA score in mission one and results of the LEfSe analysis based on the LDA score to screen the species biomarkers. LDA scores of the above 4 species between R + 1 and R + 28 differed significantly. (d) Cladogram based on different species from mission one. Red and green nodes represent the microorganisms that played important roles in each group. (e) Cluster heat map based on different species at the genus level in mission one.
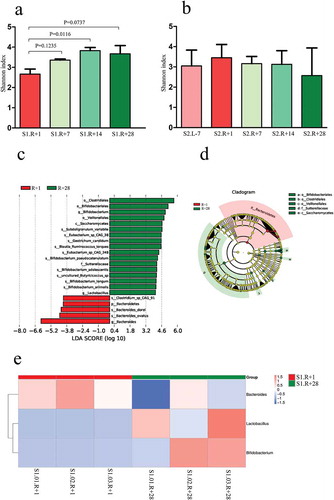
Figure 3. Relative abundances of KEGG, eggNOG and CAZy level 1 in missions one and two. (a) Relative abundance of KEGG level 1 in mission one. (b) Relative abundance of eggNOG level 1 in mission one. (c) Relative abundance of CAZy level 1 in mission one. (d) Relative abundance of KEGG level 1 in mission two. (e) Relative abundance of eggNOG level 1 in mission two. (f) Relative abundance of CAZy level 1 in mission two.
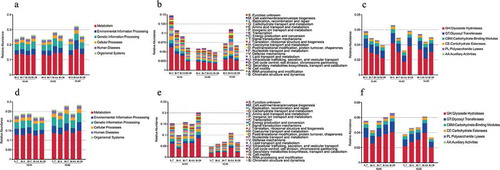
Figure 4. Resistance genes and antibiotic resistance ontologies (AROs) affected by spaceflight in missions one and two; the ARO is the core composition of the CARD database. (a) Total number of resistance genes affected by spaceflight in mission one. (b) Relative abundance of the top 20 AROs affected by spaceflight in mission one. (c) Total number of resistance genes affected by spaceflight in mission two. (d) Relative abundance of the top 20 AROs affected by spaceflight in mission two. (e) Distribution diagram of the AROs; the LDA score of the top 2 AROs is shown. (f) Cluster heat map based on different AROs.
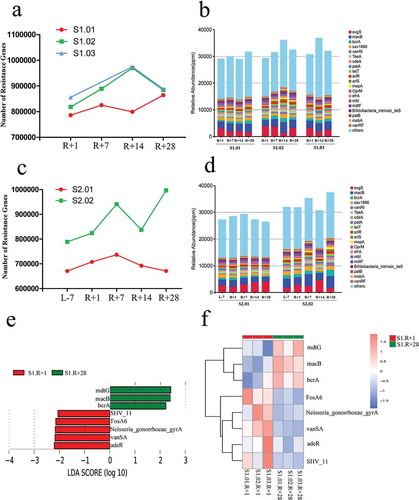
Figure 5. Relationship between species attributions at the phylum level and the resistance gene distribution in the gut microbiota. The inner circle is the ARO distribution in each species, and the outer circle is the distribution of the gut microbiota in a group. The relationship between ARO distribution and species attribution in mission one includes four groups: (a) one day after spaceflight (S1.R + 1), (b) one week after spaceflight (S1.R + 7), (c) two weeks after spaceflight (S1.R + 14) and (d) four weeks after spaceflight (S1.R + 28). The relationship between ARO distribution and species attribution in mission two included five groups: (e) one week before spaceflight (S2.L-7), (f) one day after spaceflight (S2.R + 1), g one week after spaceflight (S2.R + 7), (h) two weeks after spaceflight (S2.R + 14) and (i) four weeks after spaceflight (S2.R + 28).
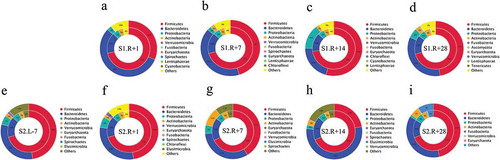
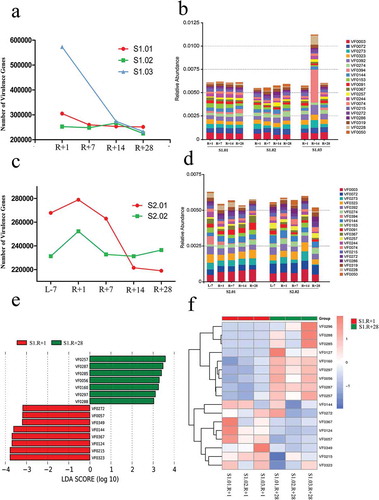
Figure 6. Virulence genes and virulence factors (VFs) affected by spaceflight in missions one and two; the VFs are the core composition of the VFDB database. (a) Total number of virulence genes affected by spaceflight in mission one. (b) Relative abundances of the top 20 VFs affected by spaceflight in mission one. (c) Total number of virulence genes affected by spaceflight in mission two. (d) Relative abundances of the top 20 VFs affected by spaceflight in mission two. (e) Distribution diagram of the VFs; the LDA score of the top 3 AROs are displayed. (f) Cluster heat map based on different VFs.