Figures & data
Figure 1. Summary of core gut microbiota in Mexican children. (a) Total number of core genera in each phylum (defined as present in >95% of samples children). (b) Abundance of core phyla across samples. (c) Median relative abundance of the 17 top core genera.
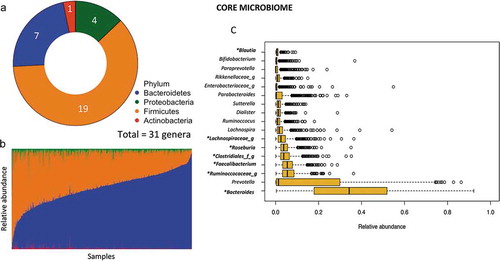
Figure 2. Structure and variation of microbial community in 926 participants of the ORSMEC cohort. (a) Top genera contributing to microbial community variation within the dataset as assessed by canonical correspondence analysis. (b) Clustering of the 926 participants based on genera composition data and using the JSD and PAM clustering. The optimal number of clusters was chosen by the Calinski–Harabasz index and validated based on the prediction strength and average silhouette width (SW). (c) Hierarchical Ward-linkage clustering based on Kendall correlation coefficients of the relative abundance of genera present in at least 25% of the samples. Co-abundance groups (CAGs) were defined based on the clusters in the vertical tree and named after their most representative taxon.
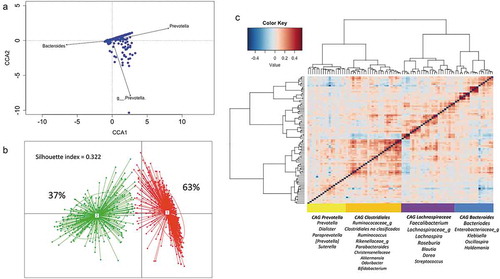
Figure 3. Age-related changes in alpha-diversity indexes of gut microbiota. (a–b) Scatter plots of Chao richness and Shannon diversity showing the progression of diversity indexes with increasing age, stratified by nutritional status. Regression lines are drawn using the loess model in R. (c) Box plot showing the Shannon diversity in normal-weight individuals per age group. The center line denotes the median, the boxes cover the 25th and 75th percentiles and points outside the whiskers represent outlier samples.
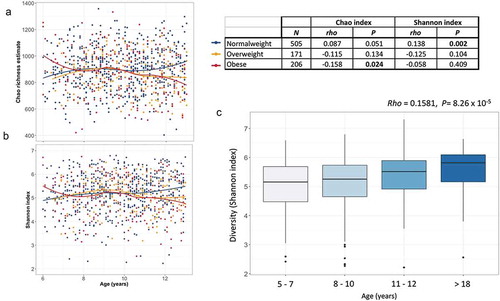
Figure 4. Explained variance of selected microbiome covariates. Horizontal bars show the amount of variance (R2) explained by each covariate in the model as determined by EnvFit function in R. The rest of the covariates and the groups within are detailed in Supplementary Table 3. Covariates are colored based on the overall metadata group. Asterisk denotes significant covariates [false discovery rate (FDR) P < 0.10] while dot denotes significant covariates in each age group before FDR correction (P < 0.05).
![Figure 4. Explained variance of selected microbiome covariates. Horizontal bars show the amount of variance (R2) explained by each covariate in the model as determined by EnvFit function in R. The rest of the covariates and the groups within are detailed in Supplementary Table 3. Covariates are colored based on the overall metadata group. Asterisk denotes significant covariates [false discovery rate (FDR) P < 0.10] while dot denotes significant covariates in each age group before FDR correction (P < 0.05).](/cms/asset/2c9824ff-165f-4c97-a5c2-0a7aaa357fb9/kgmi_a_1712985_f0004_oc.jpg)
Table 1. List of taxa significantly associated with monthly household income.
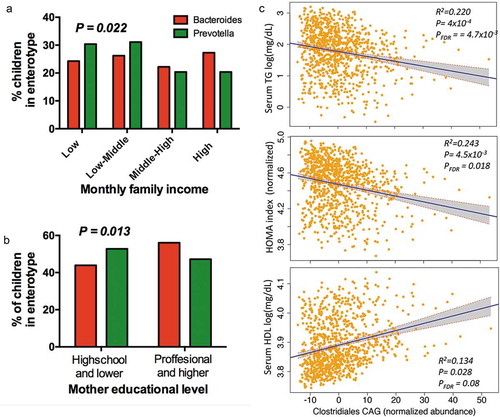
Figure 5. Association of enterotypes and CAGs with environmental variables and metabolic traits. (a) Proportional distribution of household income quartiles among enterotype. (b) Distribution of enterotypes among levels of education in children’s mothers. (c) Regression plots of Clostridiales-CAG normalized abundance with metabolic traits, controlling for technical covariates, sex, age and BMI percentile. Shaded areas show confidence intervals.