
Figures & data
Figure 1. Cotrimoxazole has multiple anti-inflammatory effects in people living with HIV. Graphical summary of the anti-inflammatory effects of cotrimoxazole identified using samples from the ARROW trial and complimentary in vitro models.Citation29 Effects of cotrimoxazole include (a) reduced circulating inflammatory mediators (CRP and IL-6), (b) suppression of viridans group streptococci (VGS), a type of bacteria that lives in the gut and promotes intestinal inflammation, which can be measured by stool levels of myeloperoxidase (MPO; a neutrophil-derived reactive oxygen species involved in antimicrobial immune responses). Stool MPO is an indicator of neutrophil accumulation and activity in the gut mucosa, (c) inhibition of pro-inflammatory mediator production (TNFα and IL-6) by immune cells activated by being experimentally exposed to bacteria, and 4) suppression of neutrophil chemoattractant protein production (IL-8) by gut epithelial cells. IL-8 is one of the signals that attracts neutrophils to the gut mucosa and perpetuates intestinal inflammation. IL-8 production is also stimulated by mevalonate pathway metabolites.
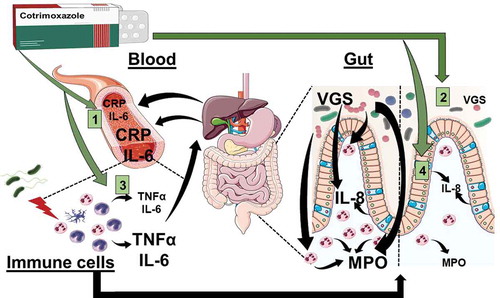
Figure 2. Comparison of gene profiles from S. salivarius strains in stool samples from ART-treated HIV-positive children randomized to continue versus stop cotrimoxazole prophylaxis. (a) Nonmetric multidimensional scaling ordination plot of S. salivarius gene presence/absence profiles in ARROW strains identified in ART-treated HIV-positive Zimbabwean children randomized to stop cotrimoxazole (orange) or continue cotrimoxazole (green), and the PanPhlAn reference strain genomes (black). The blue circle represents the minimal area occupied by ARROW strains. (b) Nonmetric multidimensional scaling ordination plot of S. salivarius gene presence/absence in ARROW strains colored from lowest stool myeloperoxidase concertation (light blue) to highest stool myeloperoxidase concentration (dark blue). (c) Boxplots showing the distance of ARROW S. salivarius strains (blue) and PanPhlAn reference strains (white) from their respective group centroids.
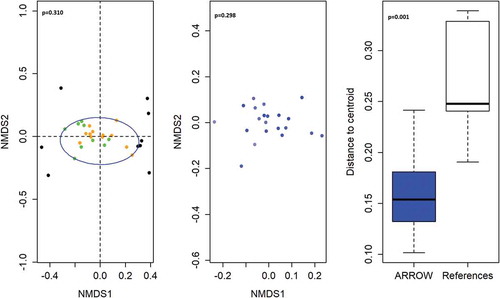
Table 1. Gene families that were more likely (enriched) or less likely (depleted) to be present in ARROW sub-study S. salivarius strains based on PanPhlan strain profiling.