Figures & data
Figure 1. Maternal gut microbial clusters and representative genus. The PAM method shows that participants are separated into two clusters (a) and Principal Component Analysis (PCA) showed the two differential clusters (b); the relative abundances (%) of the representative bacterial genus in each cluster are represented, Prevotella in Cluster I (red circles) (c) and Ruminococcus in Cluster II (blue squares) (d). The middle line represents the media of all values.
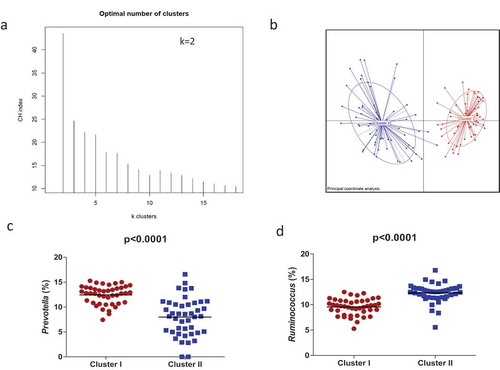
Table 1. Characteristics of mothers-neonates.
Figure 2. Maternal microbial clusters characteristics and alfa and beta diversity. Principal Coordinate Analysis (PCoA) with Bray–Curtis index (a) and Multivariate RDA (b) showed significant differences in microbial communities between clusters. Linear Discriminant Analysis (LDA) Effect Size (LEfSe) plot of taxonomic biomarkers was identified in both clusters. Cluster I (red color) and Cluster II (blue color). (c) and microbial diversity and richness indexes at species level according to each cluster (D, E, F). Mean ±SD and p-values with T-test. Cluster I = red circles and Cluster II = blue squares.
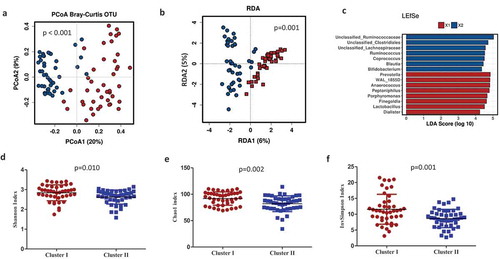
Figure 3. Maternal diet shapes the microbial clusters. Biplots from the principal component analysis (PCA) showed that maternal microbiota clusters were associated with specific microbial genus (a) and nutrients (b). Cluster I = red squares and Cluster II = blue circles. Pearson correlations between nutrient intake during pregnancy and bacterial abundance at the genus level at delivery (c). Association of dietary components with the most abundant bacterial group of each cluster. Significant correlations (p < .05) were marked by an asterisk (*). Blue squares marked the negative correlations, whereas the red color showed positive correlations as measured by Pearson’s correlations.
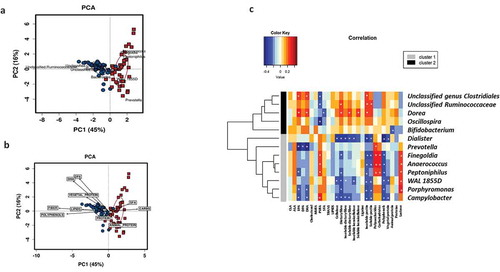
Figure 4. Maternal gut microbial clusters and diet drive the neonatal first pass microbiota. Relative abundances (%) of the neonatal microbial at the phylum level stratified by maternal microbial cluster (a). Multivariate RDA showed significant differences in neonatal microbial communities depending on maternal microbial clusters (b). Biplots from the principal component analysis (PCA) showed that neonatal microbiota is shaped by maternal microbiota clusters and they are associated with specific nutrients (c). Pearson correlations between maternal intake of nutrients during pregnancy and neonatal first pass bacterial relative abundance at phylum level at birth (d). Significant correlations (p < .05) were marked by an asterisk (*). Blue squares marked the negative correlations, whereas red showed positive correlations as measured by Pearson’s correlations.
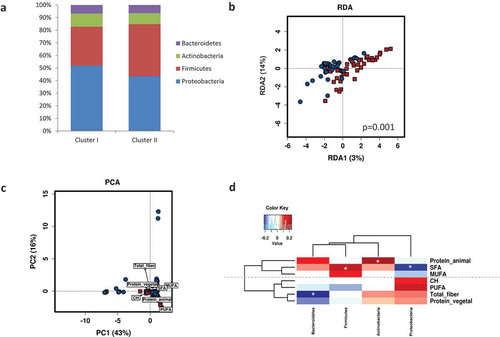
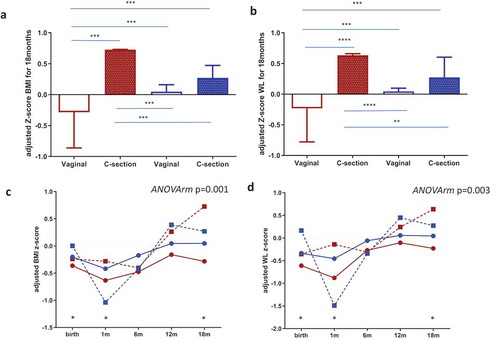
Figure 5. Maternal gut microbial clusters and mode of birth impact the infant risk of overweight and obesity. BMI z-scores(a) and WL (b) z-scores at 18 months of age adjusted by covariates according to mode of birth and maternal microbial cluster (Cluster I = red and Cluster II = blue color). The middle line represents the media of all values; a general linear model multivariate ANOVA test adjusted by factors and covariates was done and p < .05 was considered significant. **p < .05; ***p < .001; p < .0001. Infant BMI z-score (c) and WL Z-score (d) trajectories from birth to 18 months were stratified by maternal microbial cluster and birth mode. The GLM for repeated measures adjusted for maternal cluster, pregestational BMI, mode of delivery and breastfeeding up to 6 months was done and p < .05 was considered statistically significant. Points at each time represent the media and lines mark the time series. Cluster I = red and Cluster II = blue; a continuous line = vaginal birth and a dotted line = C-section plus antibiotic. * represents a significant difference in each time point between groups.