Figures & data
Figure 1. Scheme for determining the antibacterial activity of bile acids in vivo and vitro.
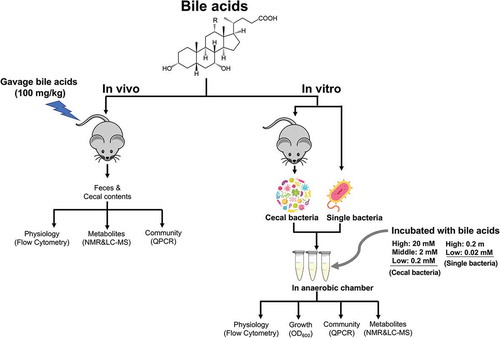
Figure 2. The growth rate and physiological response of Bacteriodes fragilis and Ruminococcus bromii to bile acid exposure in vitro.
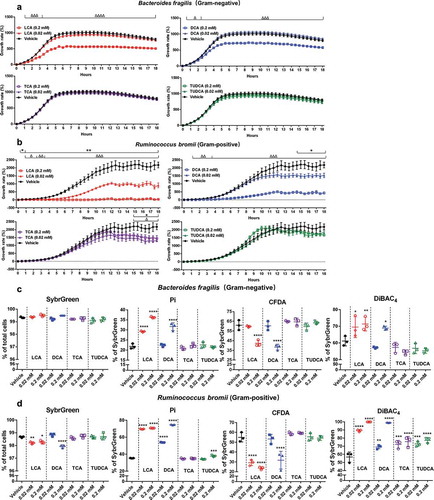
Figure 3. UPLC-MS/MS-based metabolomics analysis of Ruminococcus bromii in response to bile acid exposure in vitro.
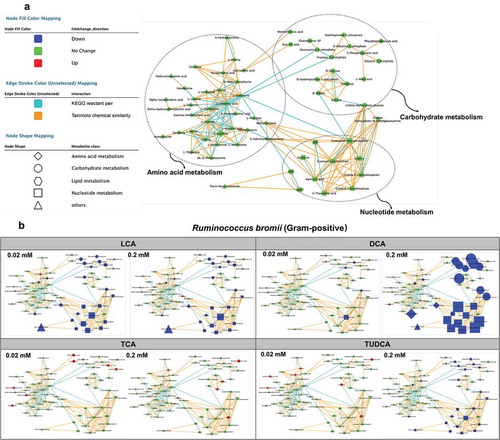
Figure 4. The growth rate and UPLC-MS/MS-based metabolomics analysis of Bifidobacterium longum in response to bile acid exposure in vitro.
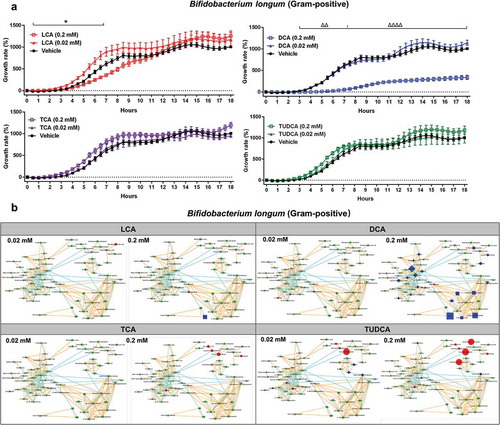
Figure 5. The growth rate and physiological response of Clostridium scindens to bile acid exposure in vitro.
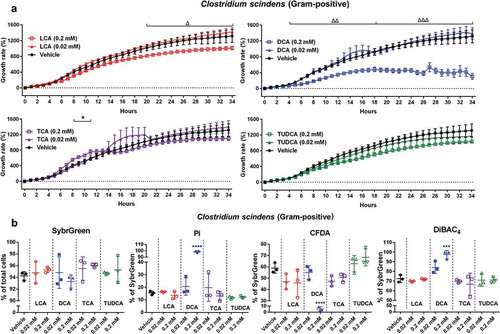
Figure 6. The bacterial community and physiological response of isolated cecal bacteria to bile acid exposure in vitro.
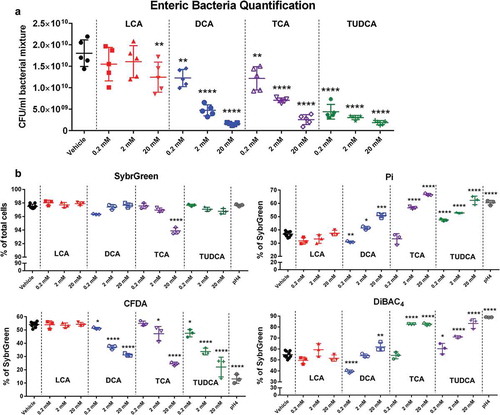
Figure 7. 1H NMR-based metabolomics analysis of isolated cecal bacteria in response to bile acid exposure in vitro.
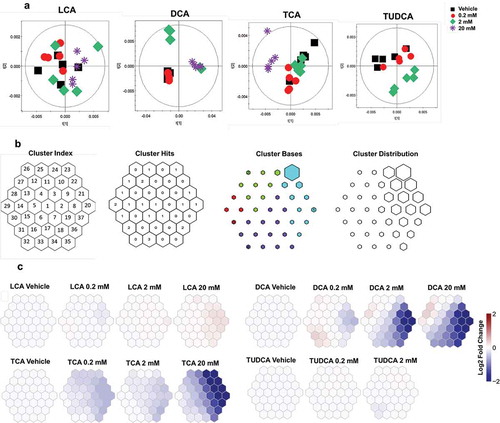
Figure 8. UPLC-MS/MS-based metabolomics analysis of isolated cecal bacteria in response to bile acid exposure in vitro.
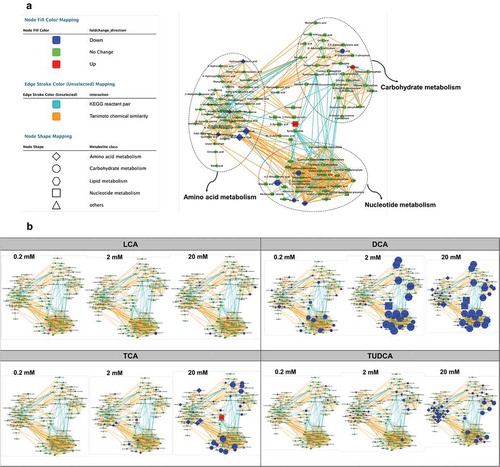
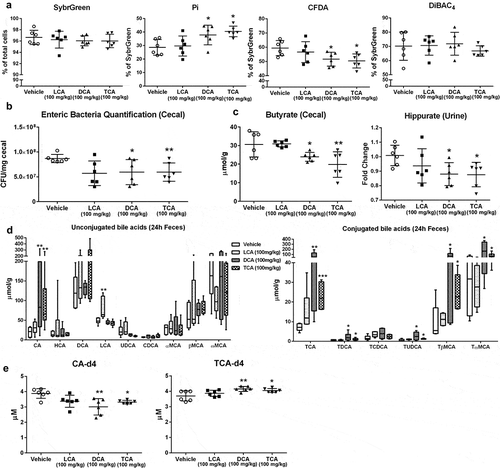
Figure 9. The response of cecal bacteria to bile acid exposure in vivo.