Figures & data
Table 1. Baseline characteristics of the discovery cohort.
Figure 1. Gut microbiota dysbiosis in lung cancer patients. (a) Numbers of OTUs observed in patients and healthy controls. (b) Microbial richness based on the Chao index and diversity based on the Shannon index. The box represented the interquartile range (IQR) between the first and the third quartiles, and the midline represented the median. Whiskers extended to values within 1.5 times IQR. Circles indicated outliers beyond the whiskers. (c) Principal coordinates analysis (PCoA) for lung cancer (orange) and healthy control samples (green). Left, Unweighted UniFrac; right, Bray–Curtis. Significant differences were observed between patients and healthy controls with ANOSIM test (UniFrac, R = 0.0912, P = .003; Bray–Curtis, R = 0.0739, P = .007). The first two principal coordinates (PCs) were each labeled with the percentage of variance explained.
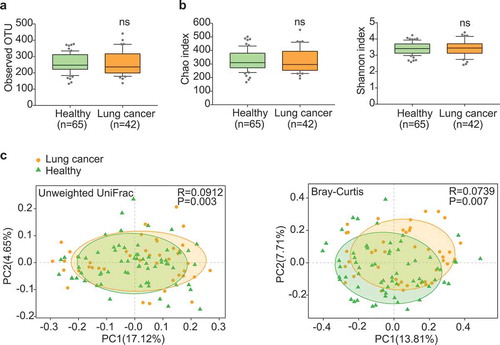
Figure 2. Differential abundance of gut microbiota in lung cancer and healthy controls. The taxa decreased (a) and increased (b) in patients with lung cancer at the phylum, genus, and species levels, p < .05. Green and orange represented the healthy controls (n = 65) and lung cancer patients (n = 42), respectively. The distributions of taxa were based on the number of reads post-filtering and rarefying. The abundance in each group was plotted as log10 scale on the y axis. P values were calculated using the two-tailed Wilcoxon rank-sum test. Description of boxplots was the same as in . Taxa were named as their lowest possible level of classification, with unclassified (unc) indicating no further classification available.
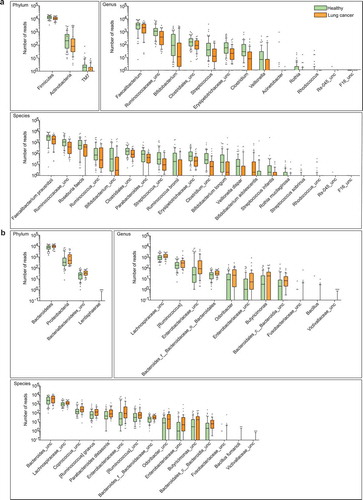
Figure 3. Association between clinical variables and gut microbiota abundance. Heat map showing the relative abundances of the 50 most abundant species in samples grouped by metastatic status (a) and lung cancer subtypes (c), respectively. Species were in rows, and the relative abundance was indicated by color gradient. The most significantly changed species were further analyzed in each group (b, d). Description of boxplots was the same as in . Two-tailed Wilcoxon rank-sum test, *p < .05, **p < .01, ***p < .001.
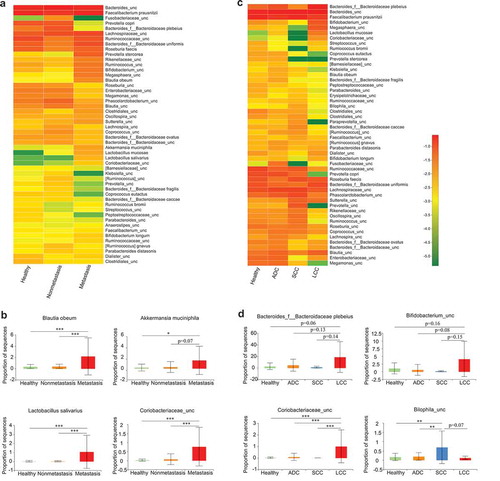
Table 2. Thirteen OTU-based markers.
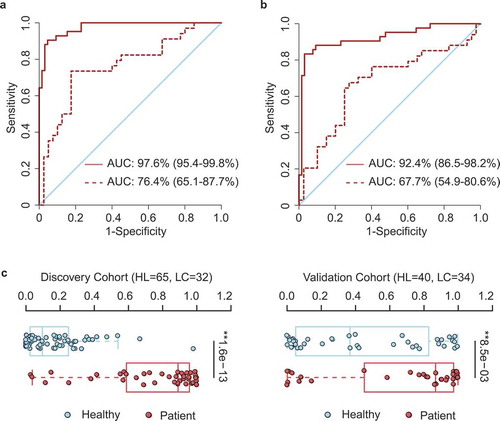
Figure 4. OTU-based diagnostic biomarkers for lung cancer. (a, b) Receiver operating characteristic (ROC) curves of prediction efficacy for the OTU-based predictors using SVM (a) and PDI (b), respectively. Solid and dashed lines indicated the discovery (patient = 42, healthy = 65) and validation (patient = 34, healthy = 40) cohorts, respectively. (c) PDI distributions in early-stage patients and healthy controls. Two-tailed Wilcoxon rank-sum test, **p < .01.