Figures & data
Figure 1. Diversity plates of isolated gut microbes. Using four types of agar, we observed a significant increase in bacterial growth in plates supplemented with insoluble fiber. The amount of growth observed in fiber-supplemented plates (SNF + Fiber) was equivalent to that documented in Gause modified freshwater plates (GMF).
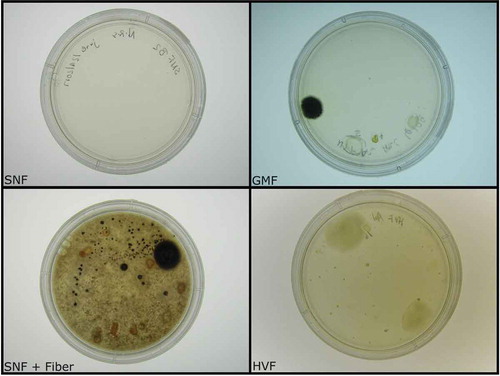
Figure 2. IDBac constructed dendrogram of cultivated bacterial isolates from the zebrafish gut. Our library is composed of over 80 isolates covering three phyla. To generate the IDBac dendrogram the following analysis settings were used: percent presence: 70, Signal-to-noise ratio: 4, Lower mass cutoff: 3,000, Upper mass cutoff: 15,0000, ppm tolerance: 1000. Distance algorithm: euclidean, Clustering algorithm: ward.D2, used presence/absence setting for dendrogram grouping.
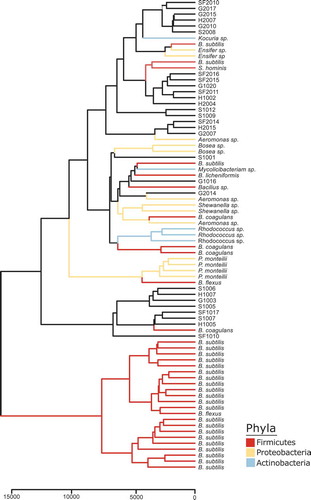
Figure 3. Comparison of metabolite production with and without fiber. (a) IDBac dendrogram of 16 isolates grown with or without fiber. (b) Metabolite association network of isolates S2008 and G2015 grown with and without fiber. (c) Metabolite association network of isolate SF2016 comparing the metabolites produced when grown with or without fiber. Any m/z nodes corresponding to matrix or agar controls were subtracted prior to analysis. To generate the metabolite association networks the analysis settings used were as follows: percent presence: 70, Signal to noise: 4, Lower mass cutoff: 200, Upper mass cutoff: 20000, ppm tolerance: 1000. Rather than displaying the metabolite association network for the entire dendrogram, specific samples were highlighted and the corresponding metabolite association network was downloaded to visualize in open graph platform Gephi (version 0.9.2) using the Yifan Hu layout.Citation19
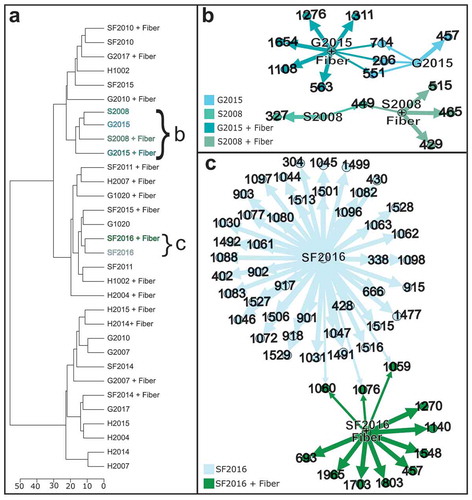
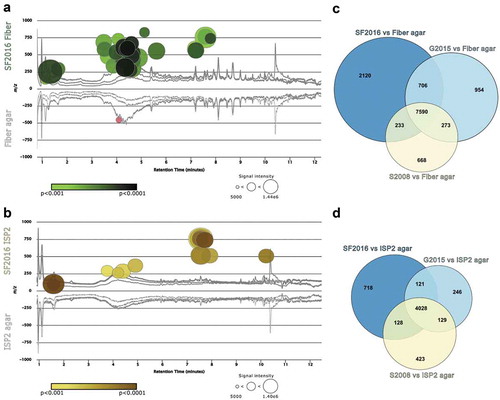
Figure 4. Gut microbe growth on fiber agar increases secondary metabolite production. HR-LC-MS data collected from metabolite extracts of library isolates SF2016, G2015, and S2008 were analyzed using XCMS pairwise and meta-analysis. (a) Cloud plot comparison of SF2016 grown on fiber agar (top) and fiber agar control (bottom) highlighting significant metabolites (circles) produced by SF2016 when grown on fiber agar. The intensity of color in a circle correlates to the increased significance of the upregulated signal. (b) Cloud plot comparison of SF2016 grown on ISP2 agar (top) and ISP2 agar control (bottom). The Venn diagrams on the right represent the number of signals that are unique to each library isolate when grown on (c) fiber agar or (d) ISP2 medium.