Figures & data
Figure 1. (A) Schematic overview of the in vivo experiment, (B) changes of body weight, food intake, and depressive-like behaviors of mice under UCMS. (C) open-field test, (D) rotarod test, (E) elevated-plus maze test, and (F) social-interaction test. Data are expressed as mean ± SD (n = 8). #Significant difference between N-Con and S-Con (#P < .05, ##P < .005, ###P < .001). *Significant difference with S-Con (*P < .05, **P < .005, ***P < .001).
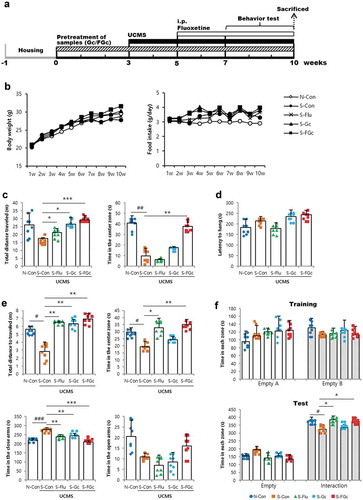
Figure 2. Effects of Gc and FGc on neuroendocrine in mice brain and colon under UCMS. (A) serum corticosterone and serotonin levels (n = 6). (B) Protein expression of NMDA2 R, CRF1 R, 5HT1AR, D2DR, and GABAAR by western blot. Lane 1 = N-Con; lane 2 = S-Con; lane 3 = S-Flu; lane 4 = S-Gc; lane 5 = S-FGc. (C) Protein expression of GPR43 and TPH-1 in mice colon by western blot. Lane 1 = N-Con; lane 2 = S-Con; lane 3 = S-Flu; lane 4 = S-Gc; lane 5 = S-FGc. Data are expressed as mean ± SD (n = 5). #Significant difference between N-Con and S-Con (#P < .05, ##P < .005, ###P < .001). *Significant difference with S-Con (*P < .05, **P < .005, ***P < .001).
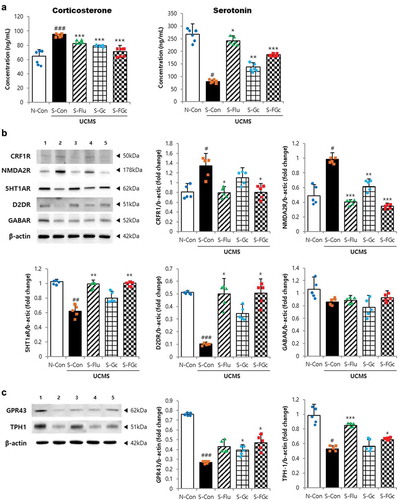
Figure 3. Effects of Gc and FGc on neurodegeneration in mice under UCMS. Expression of proteins related to neurogenesis by western blot. Lane 1 = N-Con; lane 2 = S-Con; lane 3 = S-Flu; lane 4 = S-Gc; lane 5 = S-FGc. Data are expressed as mean ± SD (n = 5). #Significant difference between N-Con and S-Con (#P < .05, ##P < .005, ###P < .001). *Significant difference with S-Con (*P < .05, **P < .005, ***P < .001).
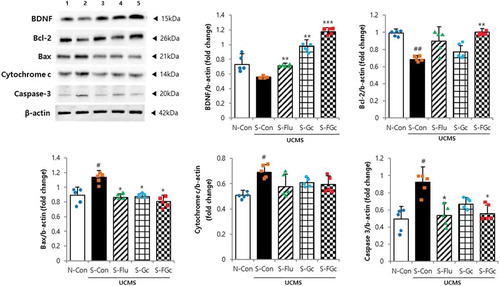
Figure 4. Effects of Gc and FGc on inflammation and barrier function of mice brain and colon under UCMS. (A) Expression of proteins related to inflammation by western blot. Lane 1 = N-Con; lane 2 = S-Con; lane 3 = S-Flu; lane 4 = S-Gc; lane 5 = S-FGc. (B) Expression of proteins related to tight junction by western blot. Lane 1 = N-Con; lane 2 = S-Con; lane 3 = S-Flu; lane 4 = S-Gc; lane 5 = S-FGc. (C) Intestinal epithelial permeability to FD4. (D) Representative H&E stained colon sections. Arrows indicate depleted epithelial cells. Data are expressed as mean ± SD (n = 5). #Significant difference between N-Con and S-Con (#P < .05, ##P < .005, ###P < .001). *Significant difference with S-Con (*P < .05, **P < .005, ***P < .001).
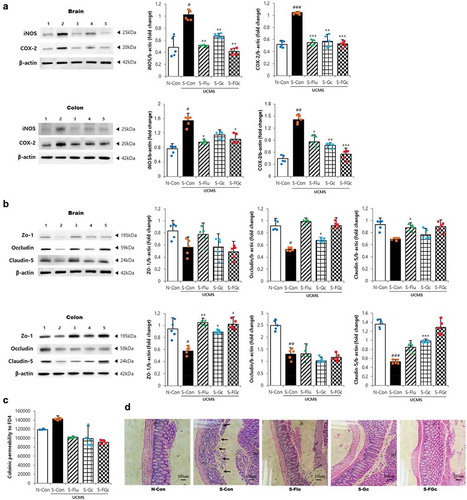
Figure 5. (A) Principal coordinate analysis (PCoA), (B) UniFrac unweighted pair-group method with arithmetic mean (UPGMA) cluster analysis, and microbial distribution at (C) phylum level and (D) class and family level.
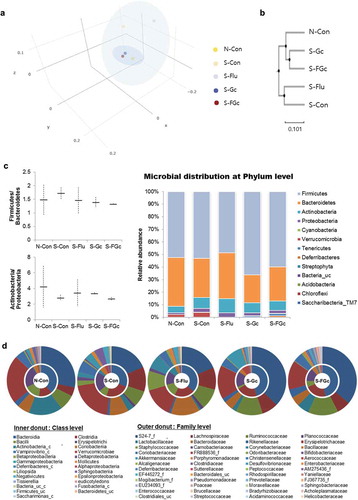
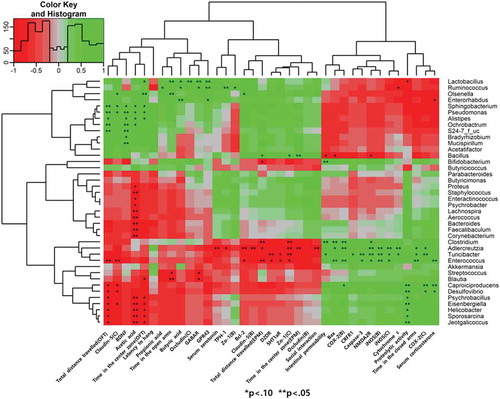
Figure 6. Heat map showing the correlation coefficients between the selected genera and stress-induced dysregulated markers. Red and green colors indicate positive and negative correlations, respectively. An asterisk indicates *P < .1, **P < .05.