
Figures & data
Figure 1. Neuronal innervation is promoted by Bt-CONV.
Expression of pan-neuronal marker PGP9.5 (red) is decreased in MYP and mucosa in GF mice compared to SPF, while, mono-colonization with Bt significantly increases PGP9.5 to SPF levels (a). Vagal afferent marker calretinin (green) shows reduced staining in GF mice compared to SPF only in the mucosa and Bt increases calretinin expression in both MYP and mucosa to similar levels of SPF (b). Quantification of PGP9.5/calretinin immunoreactivity (IR) in colonic mucosa showed a significant increase in the number of positive pixels in Bt-CONV compared to GF (c and d). N = 3–5. Yellow arrows indicate positive MYP-IR, white arrows indicate positive mucosal-IR. Error bars show SEM, and significance is p < .05 as denoted by *. Scale bar = 50 μm.
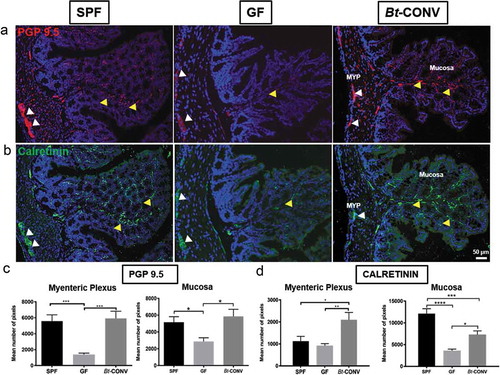
Figure 2. Bt normalizes expression of neuronal subtype post-GF perturbations.
Expression of the inhibitory neurotransmitter NOS (red) is significantly decreased in MYP in GF conditions when compared to SPF, while Bt significantly induces proliferation of NOS-IR compared to GF (a and b). Excitatory cholinergic marker ChAT is increased in MYP GF conditions compared to SPF, while Bt reduces the innervation to SPF levels (c and d). Expression of substance P is unchanged in both MYP and mucosa in GF mice compared to SPF; however, Bt significantly increases substance P-IR in both colonic regions compared to GF (e and f). There are no changes in expression pattern for CGRP in the mucosa and MYP except for a significant reduction in the MYP by Bt compared to SPF (g and h). N = 3–5. Yellow arrows indicate positive mucosal-IR, white arrows indicate positive MYP-IR. Error bars show SEM, and significance is p < .05 as denoted by *. Scale bar = 50 μm.
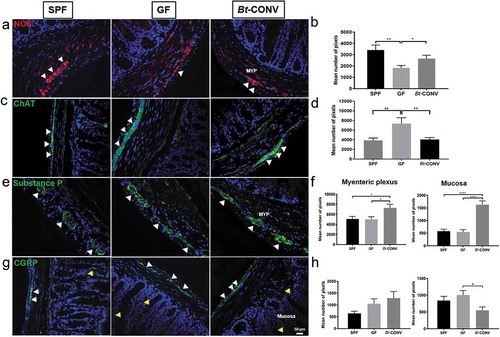
Figure 3. Bt-CONV increases neuronal budding and glial cells.
Expression of budding marker GAP43 (red) is significantly increased after Bt conventionalization compared to GF (mucosa-a and b) and SPF (MYP-c and d). Glial cell marker S100β (red) is significantly decreased in GF conditions in the mucosa compared to SPF (e and f) and Bt restores GAP43-IR to SPF levels. In MYP, S100β is unchanged in GF conditions compared to SPF; however, Bt-CONV showed a significant increase in the number of IR pixels compared to GF conditions (g and h). N = 3–5. Yellow arrows indicate positive mucosal-IR, white arrows indicate positive MYP-IR. Error bars show SEM, and significance is p < .05 as denoted by *. Scale bar = 50 μm.
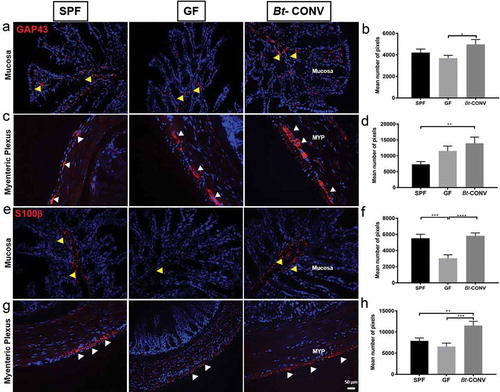
Figure 4. Bt-CONV specifically downregulates claudin 3 and upregulates TLR2 mRNA expression.
mRNA expression levels in claudin 3-a, claudin 7-b and occludin 1-c, tight junction protein (TJP-d), junctional adhesion molecule (JAM-e) in SPF, GF and Bt-CONV. Claudin 3 mRNA is significantly decreased in Bt-CONV group only (a). mRNA expression levels in toll-like receptor 1 (TLR1-f), toll-like receptor 2 (TLR2-g), toll-like receptor 4 (TLR1-h), toll-like receptor 5 (TLR5-i) and toll-like receptor 9 (TLR9-j) in SPF, GF and Bt-CONV. TLR2 mRNA is significantly decreased in GF compared to SPF but when conventionalized by Bt the expression is significantly increased compared to GF conditions (b). The expression is described relative to GAPDH and represents N = 4. Error bars show SEM, and significance is p < .05 as denoted by *. The expression is described relative to GAPDH and represents N = 4. Error bars show SEM, and significance is p < .05 as denoted by *.
Figure 5. Bt-CONV specifically normalizes L-cells only.
GLP-1 found in L cells is increased in GF conditions; however, this is restored by Bt-CONV back to SPF levels (a and b). 5-HT containing EC cells is similarly increased in GF mice, however, unaltered in Bt-CONV (c and d). ChAT containing tuft cells is unchanged across all groups (e and f). N = 3–5. Error bars show SEM, and significance is p < .05 as denoted by *. Scale bar = 50 μm.
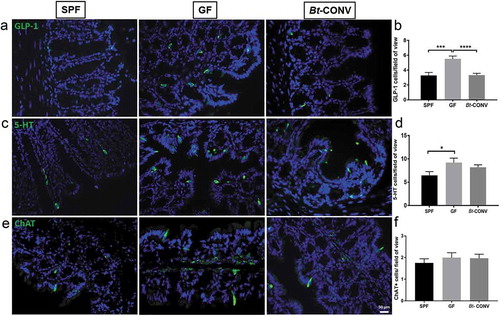
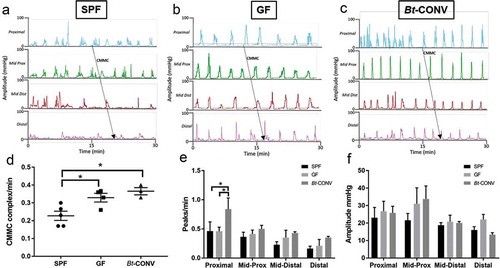
Figure 6. Coordinated colonic contractions are regulated by Bt.
Raw traces showing manometric pressure recordings in the whole colon in SPF (a), GF (b) and Bt-CONV (c). The number of colonic migrating motor complexes (CMMCs)/min is significantly increased in GF conditions compared to SPF and further upregulated in Bt-CONV compared to GF conditions (d). The frequency of contractions (peaks/min) is only increased in Bt-CONV compared to SPF and GF only in the proximal colon. The amplitude of contractions across all colonic regions and mouse groups is unchanged. N = 5. Error bars show SEM, and significance is p < .05 as denoted by *.
Supplemental material