
Figures & data
Figure 1. H. pylori infection affects DNA damage response signaling pathway. (a) Representative images of Western blot analysis for γH2AX in GES-1 cells with H. pylori NCTC11637 infection at different MOI or at different time points. (b) The comet assay for assessing DNA damage in GES-1 cells with or without H. pylori. Scale bar, 10 μm. (c) Immunochemistry for γH2AX in gastric tissues collected from Mongolian gerbils that were challenged with H. pylori NCTC11637 strain or Brucella broth for 6 months (H. pylori, n = 30; control, n = 15) or 12 months (H. pylori, n = 30; control, n = 10). (d) Representative images (200× magnification) of Western blot analysis for p-p53 (Ser20), p-p53 (Ser15), p-Chk2 (Thr168), Chk1, p-ATM (Ser1981), ATM in GES-1 cells infected with H. pylori NCTC11637 at different time points. (e) Flow cytometry analysis for cell cycle distribution after H. pylori infection. (f) Representative immunohistochemical staining for p-ATM (S1981), p-Chk2 (T68) and p-p53 (S15) in a series of human gastric tissues with Correa cascade from CNAG, IM, Dys and GC. Quantitative analysis of the immunohistochemical staining results in gastric tissues. *P < .05, **P < .01. (g) Representative images of Western blot analysis for Rad51 in GES-1 cells with H. pylori NCTC11637 infection. (h) Representative images of Western blot analysis for γH2AX, p-p53 (Ser20) and p-p53 (Ser15) in GES-1 cells, which were treated with H. pylori in combination with plasmid expressing Rad51 or Rad51 siRNAs. A representative blot of three independent experiments was shown. (i) After transfected with Rad51 expression plasmid or Rad51 siRNAs, the comet assay was performed to detect DNA damage and the length of tail DNA was evaluated in gastric cells with H. pylori infection. (j) Immunohistochemistry staining images (200× magnification) for Rad51 in gastric tissues of Mongolian gerbils infected with H. pylori. Scale bar: 50 μm. All in vitro experiments were independently repeated three or more times. *P < .05, **P < .01.
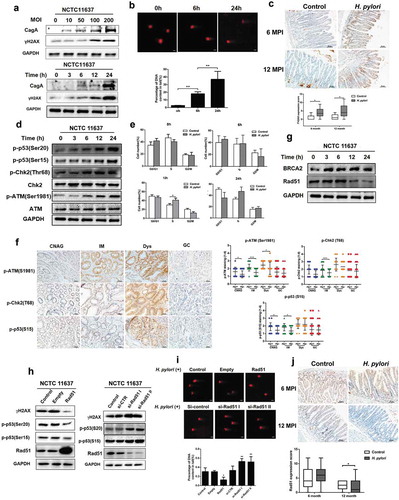
Figure 2. Autophagy is dynamically changed in response to H. pylori infection. (a) Representative images of Western blot analysis for LC3 in GES-1 cells co-cultured with H. pylori NCTC11637. (b) Transmission electron microscopy showing autophagosomes in gastric cells with or without H. pylori infection. Scale bar: 500 μm. (c) The Mongolian gerbils were challenged with H. pylori NCTC11637 strain or Brucella broth 6 months (H. pylori, n = 30; control, n = 15) or 12 months (H. pylori, n = 30; control, n = 10). Representative p62 immunohistochemical staining images in gastric tissues were shown. Scale bar: 50 μm. (d) Quantification of staining scores for p62 in gastric epithelium. (e) After transfection with mRFP-GFP-LC3 adenovirus, cells were incubated with H. pylori and Confocal microscopy was used to monitor the autophagic flux. Scale bar, 10 μm. (f) The numbers of autophagosome (mRFP+GFP+) and autolysosome (mRFP+GFP−) were quantified. All in vitro experiments were independently repeated three or more times. *P < .05, **P < .01, ***P < .001.
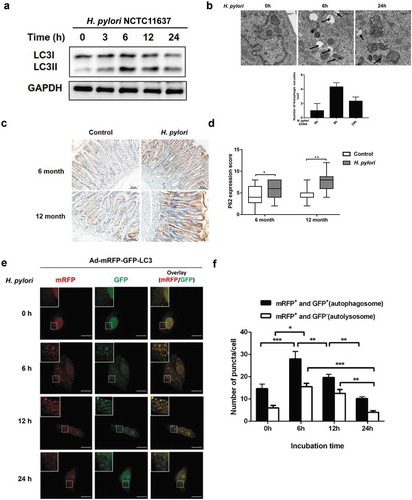
Figure 3. Inhibition of autophagy increased DNA damage in response to H. pylori infection. (a) Representative images of Western blot analysis for p62, LC3, Rad51, p-p53 (S15), p-p53 (S20), γH2AX protein in GES-1 cells infection with H. pylori (MOI 200) for 12 hand treatment with autophagy inhibitors (3-MA, BafA1) or autophagy activators (Rapamycin, Starvation). (b) Immunofluorescence assay showing γH2AX (red) and Rad51 (green) expressions in GES-1 cells treated with autophagy inhibitors or autophagy activators and then infected with H. pylori (MOI 200) for 12 h. Scale bar, 10 μm. (c) After treatment with autophagy-related drugs and H. pylori, DNA damage was determined by the Comet assay in GES-1 cells. Scale bar, 10 μm. (d) Comet tail lengths showing DNA damage. (e) Flow cytometry analysis showing cell cycle progression in cells treated with autophagy inhibitor or activators and then infected with H. pylori (MOI 200) for 12 h. All experiments were independently repeated three or more times. *P < .5, **P < .01.
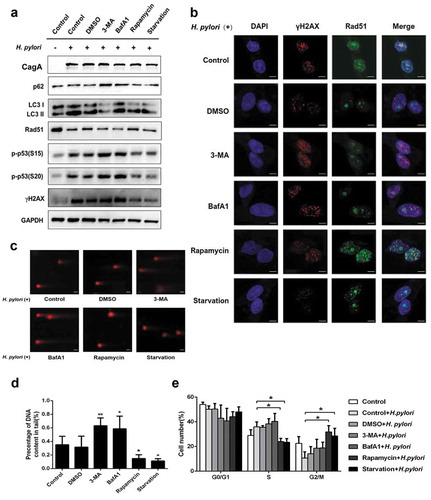
Figure 4. Rad51 is a crucial adaptor in autophagy-regulated DNA damage in response to H. pylori infection. (a, b) Representative images of Western blot analysis for γH2AX, Rad51, p-p53 (S20) and p-p53 (S15) protein levels in GES-1 cells following H. pylori infection (MOI 200) for 12 h, and transfection with Rad51 expression plasmids in the presence of autophagy inhibitor treatment (a) 3-MA or (b) BafA1. (c, d) Representative images of Western blot showing expression of γH2AX, Rad51, p-p53 (S20) and p-p53 (S15) in GES-1 cells transfected with Rad51 siRNAs, infected with H. pylori (MOI 200) for 12 h and treated with autophagy inducer (c) rapamycin or (d) starvation. (e) Comet assay showing DNA damage in GES-1 cells transfected with Rad51 expression plasmid, and then infected with H. pylori for 12 h in the presence of autophagy inhibitors 3-MA or BafA1. Scale bar, 10 μm. (f) Comet assay showing DNA damage in GES-1 cells transfected with Rad51 siRNAs, and then infected with H. pylori for 12 h in the presence of autophagy inducers rapamycin or starvation. Scale bar, 10 μm. All in vitro experiments were independently repeated three or more times. *P < .5, **P < .01.
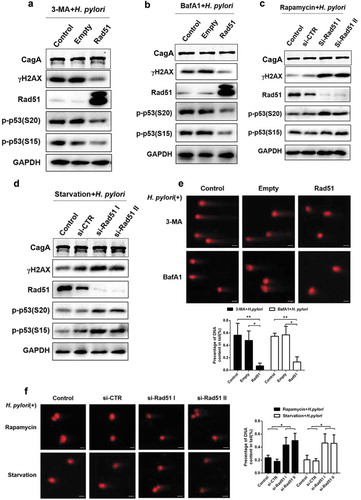
Figure 5. H. pylori-Susceptible DNA damage response and autophagy are shared between different bacterial strains, cell types and animal models. (a) Representative images of Western blot analysis for p62, Rad51 and γH2AX in GES-1 cells infected with H. pylori 7.13 at different MOI or at different time points. (b) Transmission electron microscopy for autophagic vacuoles in gastric cells infected with H. pylori 7.13. Scale bar: 500 μm. (c, d) Representative images of Western blot analysis for CagA, p62, Rad51 and γH2AX in gastric cells (c) GES-1, or (d) AGS infected with H. pylori strain 7.13 or its CagA-knockout mutant. (e) H&E staining for gastric pathology in gastric tissues of H. pylori-infected C57BL/6 mice. (f) Immunohistochemistry staining for Rad51 and p62 levels in C57BL/6 mice infected with H. pylori. Scale bar: 50 μm. (g) Western blot analysis for Rad51 and p62 protein levels in gastric tissues of H. pylori-infected mouse model. Images are representative of n = 3 mouse stomachs. All in vitro experiments were independently repeated three or more times. **P < .01, ***P < .001.
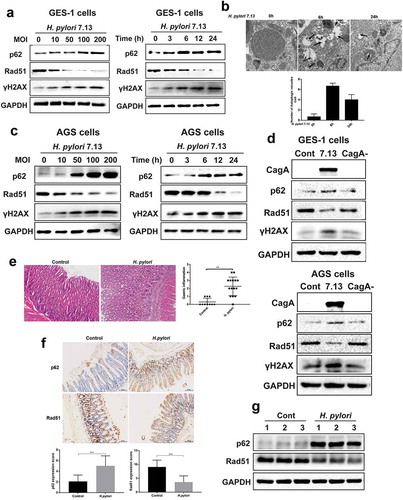
Figure 6. Accumulation of p62 suppressed DNA repair protein Rad51 in response to H. pylori infection. (a) Representative images of Western blot analysis for p62 and Rad51 proteins in GES-1 and AGS cells transfected with plasmid expressing p62. (b) Representative images of Western blot analysis for p62 and Rad51 proteins in GES-1 and AGS cells transfected with p62 shRNAs. (c, d) After transfected with p62 shRNAs, (c) GES-1 cells or (d) AGS cells showing p62 and Rad51 levels by immunoblot assay following H. pylori infection. (e) H&E staining showing the extent of gastric inflammatory response in C57BL/6 mice infected with H. pylori alone or combined with everolimus treatment. (f) Immunohistochemistry staining showing p62 and Rad51 levels in C57BL/6 mice treated with H. pylori and autophagy inducer everolimus by gastric gavage. Scale bar: 50 μm. (g) Western blot analysis for p62 and Rad51 in gastric tissues of mouse models. Images are representative of n = 3 mouse stomachs. All in vitro experiments were independently repeated three or more times. *P < .05, **P < .01.
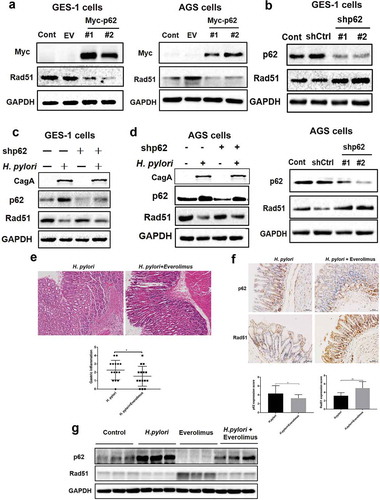
Figure 7. P62 induced H. pylori infection-mediated Rad51 ubiquitination. (a) Gastric epithelial cells were co-cultured with H. pylori strain and incubated with proteasome inhibitor MG132. P62 (green) and Rad51 (red) protein levels were measured by Western blot assay. A representative blot of three experiments was shown. (b) AGS or GES-1 cells were co-transfected with plasmids expressing Rad51 and ubiquitin, then infected with H. pylori strain 7.13 or its CagA-knockout mutant and incubated with proteasome inhibitor MG132. Lysates were detected for polyubiquitinated Rad51 by immunoprecipitation assay. (c) Immunofluorescence assay for the intracellular localization of Rad51 and p62 in gastric epithelial cells following H. pylori infection. Scale bar, 10 μm. (d) The interaction between Myc-p62 and Flag-Rad51 was examined using immunoprecipitation assay. (e) AGS or GES-1 cells were co-transfected with plasmids of Flag-Rad51, Myc-p62, P62-△UBA and HA-ubiquitin, and then incubated with MG132. Immunoprecipitation assay was used to determine polyubiquitinated Rad51. (f) Stability of Rad51 protein was analyzed in gastric epithelial cells transfected with p62 shRNA using the cycloheximide chase method. (g) AGS or GES-1 cells were co-transfected with plasmids of Flag-Rad51, Myc-p62, P62-△UBA and HA-ubiquitin, and then incubated with MG132. Immunoprecipitation assay was used to determine polyubiquitinated Rad51. All experiments were independently repeated three times.
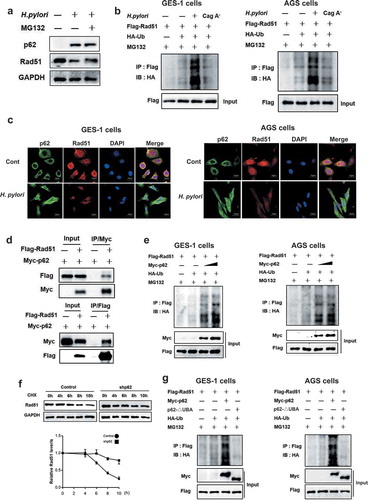
Figure 8. The expression of p62 and Rad51 in the human gastric carcinogenesis cascade (a, b) Immunohistochemical staining for p62 and Rad51 in serial tissue sections from human gastric mucosa with different stages (CNAG, IM, Dys and GC) of the Correa histopathological cascade. (c) Expression levels of p62 and Rad51 were compared between H. pylori+ and H. pylori- gastric tissues with different stages (CNAG, IM, Dys and GC) of the Correa histopathological cascade. (d) Models of the regulation of autophagy-DNA damage axis in response to H. pylori infection. **P < .01, ***P < .001. All experiments were independently repeated three times.
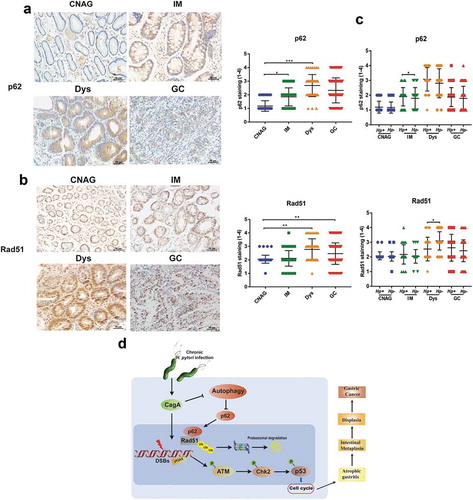
Table 1. The distribution of gender and age between different groups.