
Figures & data
Figure 1. Role of lon in Adhesion and Invasion of HeLa and HepG2 and macrophage survival.
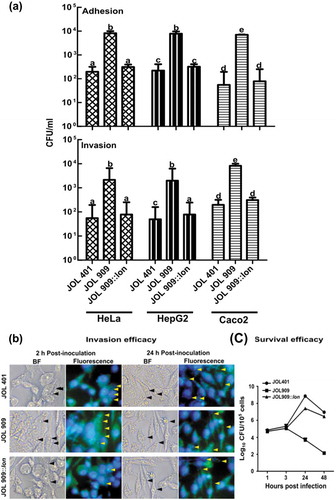
Figure 2. Actin polymerization is a distinctive attribute of individual host cells.
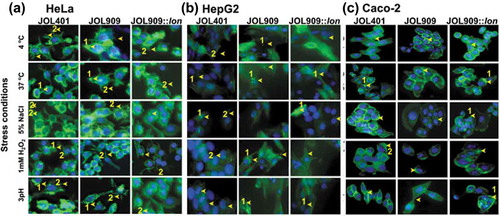
Figure 3. Endogenous Hydroxyl radical (OH·) formation during stress treatments in the lon mutant.
Figure 4. Expression of bacterial cell surface protein genes during stress treatments.
Figure 5. Expression of regulatory genes that participate in iron uptake and sequestration during stress exposure.

Figure 6. Regulation of Magnesium uptake associated genes.
Figure 7. Expression of a virulence-associated gene from SPI 1 and 2 gene clusters.
Figure 8. Bacterial recovery and survival to study the involvement of lon in bacterial longevity.
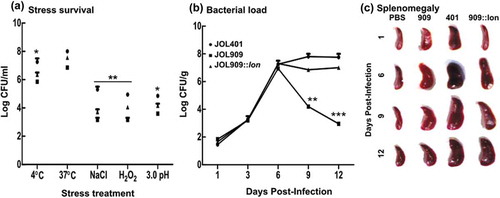
Figure 9. The kinetics of cytokine gene expression in the phagocytic and non-phagocytic epithelial cells.
Table 1. List of bacterial strains and plasmids used in this study.
Table 2. List of primers used in this study.
Supplemental Material
Download Zip (382.1 KB)Data availability statement
The fluorescent microscopy imaging conducted for Salmonella mediated actin cytoskeleton rearrangement compiled and has been deposited in the Mendeley Data repository and can be accessed using the following link. Lee, John Hwa (2020), “Salmonella mediated actin condensation upon entry into HeLa and HepG2 cells”, Mendeley Data, V1, doi: 10.17632/czng5n4fdk.1.