Figures & data
Table 1. Descriptive characteristics of participants in the fiber and omega 3 intervention arms at baseline and follow-up, respectively, both interventions were well tolerated with no major adverse events (AEs) reported. No differences in measures of habitual diet as assessed by FFQ were observed in either arm between baseline and follow-up (not shown)
Figure 1. (a) Difference in Shannon α diversity index between inulin fiber and omega-3 at baseline and follow up (p = .62). (b) Differences in beta diversity index between inulin fiber and omega-3 at visit 1 (baseline) and visit 2 (follow up). P-values assessed by paired t-test
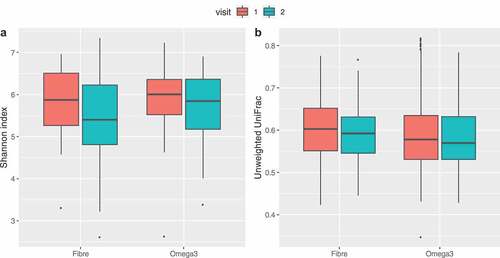
Figure 2. Forest plot of effect sizes with 95% confidence intervals showing association of all significant (FDR adjusted p value <.05) OTUs in the Fiber and omega-3 intervention arms. Smaller dots on the fiber and omega-3 arm indicate a loss of statistical significance. Association was tested by paired t-tests between baseline and follow-up
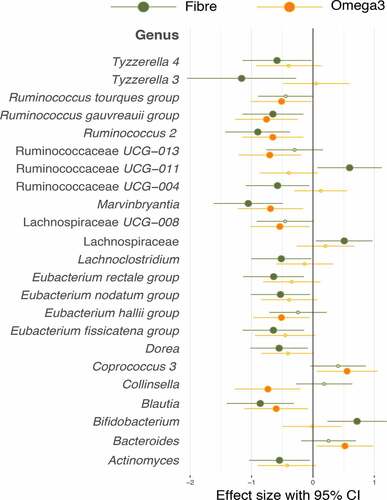
Table 2. Changes in the levels of serum metabolites in both arms (p-values from paired t-tests)
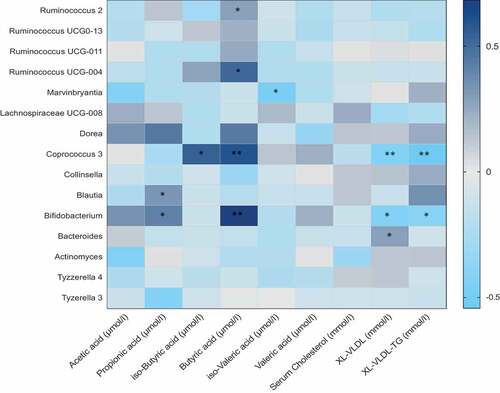
Figure 3. Heat map showing OTUs clustered at genus level and their association with serum metabolites. Values are beta coefficients from linear models adjusted for BMI, age and gender. The heat map is color coded by correlation according to the table legend (dark blue for positive and light blue for negative correlations). p values are adjusted for FDR and are indicated as FDR p < .05 (*) p < .01 (**)