Figures & data
Figure 1. Flow of information for machine learning (ML). Vast quantities of experimental data are uploaded to online globally accessible databases. These data can then be mined and used by ML algorithms
Figure 2. Supervised machine learning steps. Labeled data is split into training and testing sets. The algorithm is then trained to learn the differences between the labeled data. The test set is used to check and refine algorithm performance. Predictions can subsequently be made using new data previously unseen by the algorithm
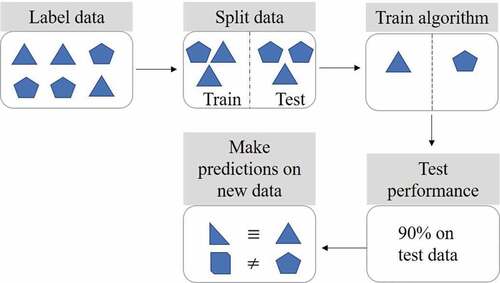
Table 1. Types of machine learning
Figure 3. Illustration of underfitting and overfitting in simple regression machine learning. Data points are represented by green markers and model fitting by a red line
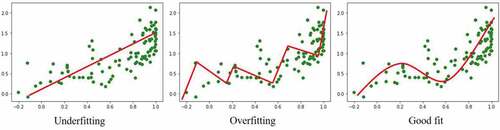
Table 2. Summary of key databases with potential utility in ML microbiome projects. Databases have been divided into: drugs, drug-microbiota interactions, microbiota, and microbiota-human interactions
Figure 4. Example of a deep neural network for application in probiotic screening. Input information describing a bacterial strain is fed into hidden layers of the network. Progressing through the layers, the algorithm approaches its output: the predicted intestinal colonization efficiency of the bacteria, when administered as a probiotic
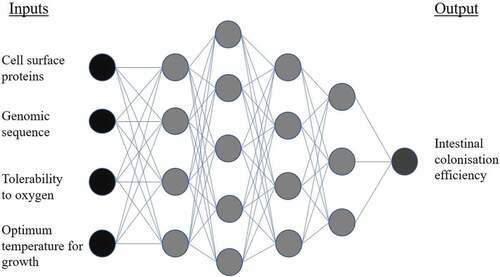
Table 3. Types of microbiome therapeutics
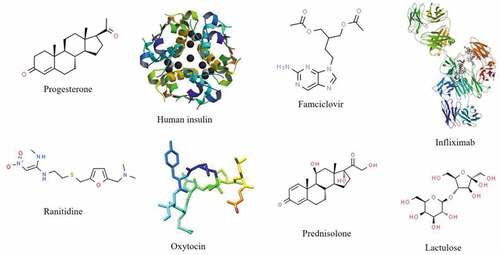
Figure 5. Various drugs proven to be susceptible to metabolism by gut microbiota.Citation10,Citation32,Citation33,Citation172–177