Figures & data
Figure 1. Dense band of bacteria forms overlying colonic mucosa
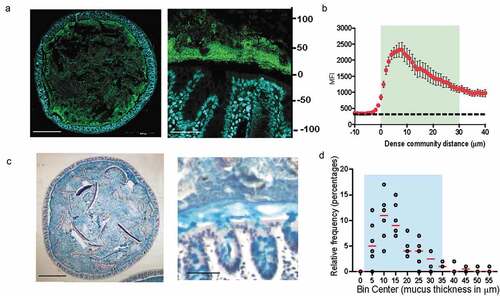
Figure 2. Mucus-associated dense community is compositionally distinct from adjoining sparse community
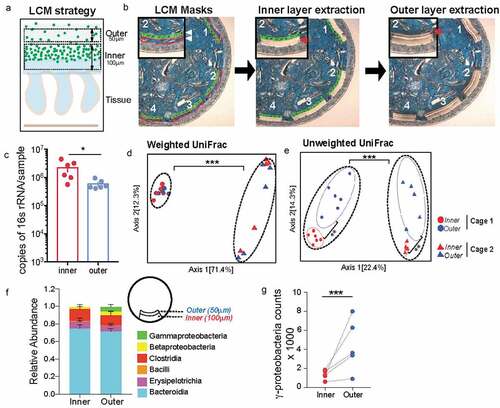
Figure 3. Inner dense community has significantly higher species richness due to presence of low abundance unique amplicon sequence variants (ASVs)
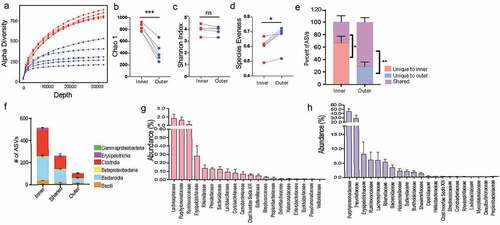
Figure 4. Mice deficient in adaptive immunity still form biofilm-like community with some changes to composition
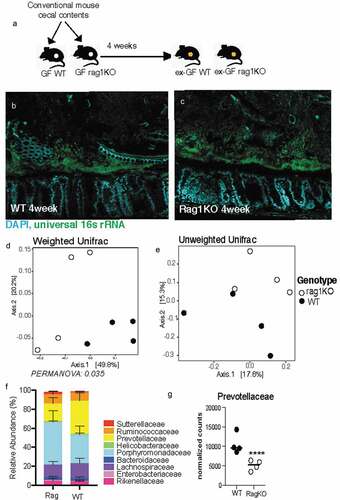
Figure 5. Dense community structure is sensitive to Vancomycin
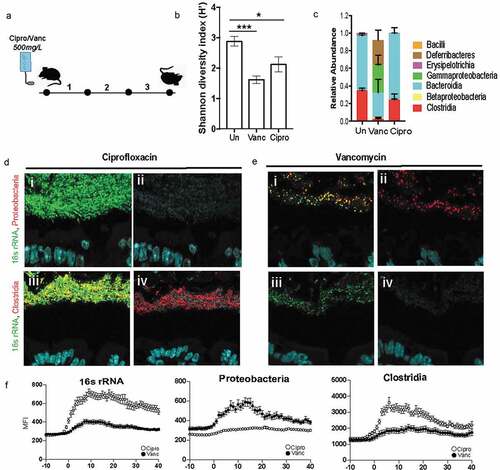
Figure 6. Following antibiotic treatment inner dense community maintains higher species richness and is less prone to dysbiosis than luminal community
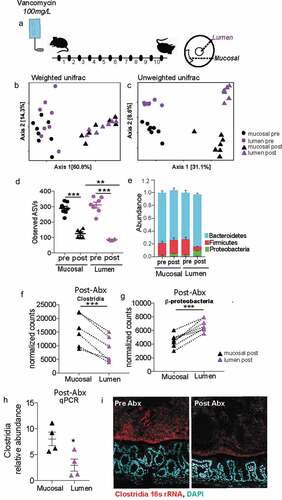
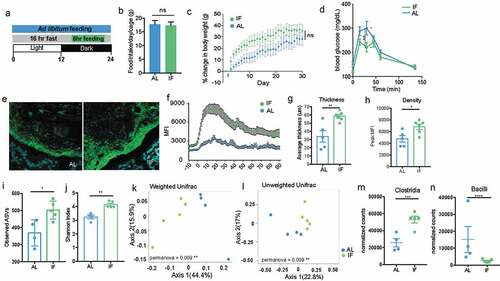
Figure 7. Intermittent fasting increases thickness and density of biofilm-like community and significantly alters community composition