Figures & data
Table 1. List of probiotics strain and their effect on different disorders
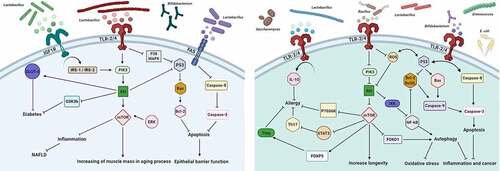
Figure 1. Schematic representation of the complex crosstalk between probiotics and the PI3K/AKT/mTOR signaling network, whereby extracellular and intracellular signals converge to orchestrate canonical upstream and downstream pathways to modulate a wide range of biological processes involved in various disorders. A detailed description of these interactions is provided in the text. Right: Up-regulation of PI3K/AKT/mTOR signaling cascade by probiotics. Left: Down-regulation of hyperactivated PI3K/AKT/mTOR signaling pathway by probiotics. Arrows indicate positive regulation (activation/stimulation), bar-headed lines indicate negative regulation (inhibition). The abbreviations shown in the figure can be found in the main text. (Figure was designed by https://biorender.com)