Figures & data
Table 1. Characteristics of human participants. *p < .05 unpaired t-test non-AN vs. AN T1 and non-AN vs. AN T2; ^p < .05 paired t-test AN T1 vs. AN T2
Figure 1. Body composition in non-AN, AN T1, and AN T2 recipient mice. (a) Percent change in body weight, (b) lean mass, and (c) fat mass of germ-free mice over the course of 4 weeks colonized with fecal microbiotas from non-AN individuals, patients with AN at time of admission to (AN T1), and patients with AN at time of discharge from (AN T2) the inpatient eating disorder unit. (d) Gonadal fat weight 4 weeks after colonization and (e) average daily food consumption in germ-free mice colonized with fecal microbiotas from non-AN, AN T1, or AN T2 human donors. Mean±SEM
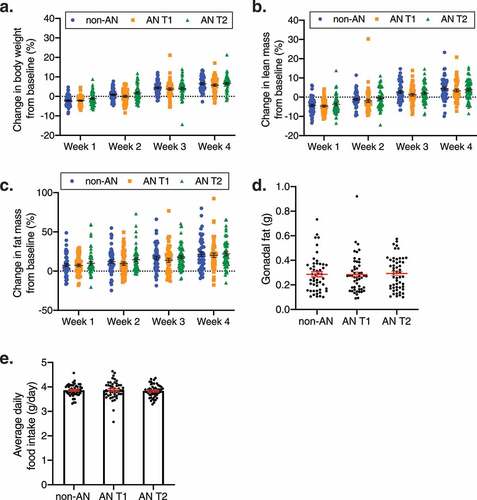
Figure 2. Small intestinal and cecum weights in non-AN and AN (T1 & T2) recipient mice. (a) Small intestine weight, (b) relative small intestine weight, (c) cecum weight, and (d) relative cecum weight of germ-free mice colonized with fecal microbiotas from non-AN individuals, patients with AN at time of admission to (AN T1), and patients with AN at time of discharge from (AN T2) the inpatient eating disorder unit. Relative small intestine weight and relative cecum weight are defined as gram of tissue per gram of mouse body weight at time of euthanasia. Mean±SEM
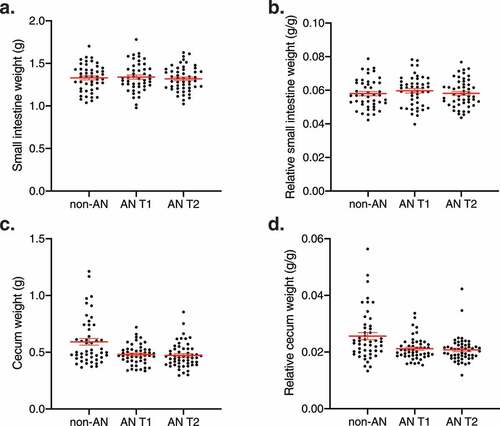
Figure 3. Diversity between and within fecal microbial communities in colonized mice. (a) Shannon diversity of fecal pellets from mice colonized with fecal microbiotas from non-AN individuals, patients with AN at time of admission to (AN T1), and patients with AN at time of discharge from (AN T2) the inpatient eating disorder unit. (b) Multi-dimensional analysis of donor stool samples and all fecal samples collected from recipient germ-free mice colonized with fecal microbiotas from non-AN controls and patients with AN (AN T1 and AN T2). (c) Average Bray–Curtis distances within and between groups. (d) Average microbial taxonomic profile at the family level from the fecal pellets of mice colonized with fecal microbiotas from non-AN individuals, patients with AN at time of admission to (AN T1), and patients with AN at time of discharge from (AN T2) the inpatient eating disorder unit at week 4 following colonization. Mean±SD. *adjusted p<.05, **adjusted p<.01, ***adjusted p<.001
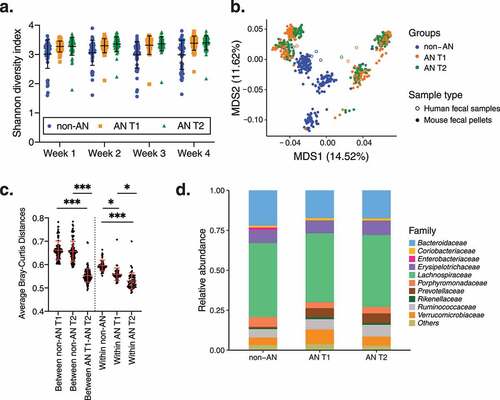
Figure 4. Bacterial load and engraftment rate of AN-patient and non-AN fecal slurries and recipient mice. (a) Copies of 16S rRNA genes per gram of DNA in donor fecal slurries. Mean±SEM. (b) Percent shared sequence variants (SVs) between donor samples and fecal slurries between patients with AN and non-AN donor groups. Mean±SD. (c) Percent shared sequence variants (SVs) between fecal slurries and recipient mice between patients with AN and non-AN donor groups. Mean±SD. *p<.05, **p<.01
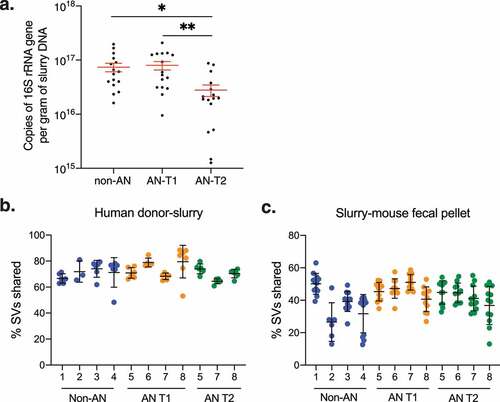
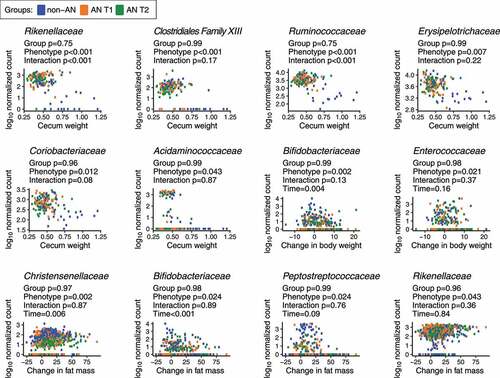
Figure 5. Bacterial families associated with physiological changes in non-AN and AN (T1 & T2) recipient mice. p-values shown are from a linear mixed-effects model with log10-normalized bacterial taxa as the dependent variable; groups, study outcomes, group and study outcome interactions, and time as fixed effects; and donors as random effects. p-values were adjusted using the Benjamini-Hochberg procedure at a 5% false discovery rate (FDR)