5,346
Views
13
CrossRef citations to date
0
Altmetric
Review

Understanding the relationship between norovirus diversity and immunity

ORCID Icon, ORCID Icon & ORCID Icon
Article: 1900994 | Received 02 Sep 2020, Accepted 01 Mar 2021, Published online: 30 Mar 2021

Figures & data

Figure 1. Structure and variable antigenic sites of the human norovirus major capsid protein, VP1. (a) The norovirus capsid is composed of 90 dimers of VP1 arranged in a T = 3 icosahedral symmetry. (b) The VP1 protein is divided into the conserved Shell (S) and the variable Protruding (P) domains. The P domain is further divided into the P1 and P2 subdomains. The surface-exposed P2 subdomain is thought to dictate binding to the cellular attachment factors, histo-blood group antigen (HGBA) carbohydrates (highlighted in green), while the S domain forms the core of the viral particle.Citation2 (c) The known variable antigenic sites (A, C, D, E, and G) located on the surface of the P2 subdomain of GII.4 norovirus are highlighted. The structural models were rendered using UCSF Chimera (version 1.11.2) and the following Protein Data Bank (PDB) files: 1IHM and 2ZLE (Norwalk virus, GI.1) and 2OBS (VA387 virus, GII.4 Grimsby variant). (d) Residues mapping on the variable antigenic sites of GII.4 noroviruses. Changes on these sites correlate with the emergence of GII.4 variants. (e) Amino acid variation in the P domain of the VP1 protein and its correlation with GII.4 variant distribution was quantified with Shannon entropy (left) and adjusted Rand index (right). Dataset includes sequences collected from 1995 to 2016, as described in Tohma et al., 2019.Citation70 Entropy values were calculated using the Shannon Entropy-One tool, as implemented in Los Alamos National Laboratory (www.hiv.lanl.gov) for six major GII.4 variants. The boxplot shows mean and standard deviation from each antigenic and non-antigenic site of major variants and all-in sequences that included a maximum of 50 randomly subsampled strain/variant to reduce sampling bias (n = 474). The dotted line indicates the mean of entropy values from non-antigenic sites in the subsampled all-in dataset. Adjusted Rand index, in which higher index values indicate a higher degree of correlation between variant distribution and the amino acid variation, was calculated with the subsampled all-in dataset using R and presented in a dot plot. Each circle represents the index from each antigenic and non-antigenic site

Figure 1. Structure and variable antigenic sites of the human norovirus major capsid protein, VP1. (a) The norovirus capsid is composed of 90 dimers of VP1 arranged in a T = 3 icosahedral symmetry. (b) The VP1 protein is divided into the conserved Shell (S) and the variable Protruding (P) domains. The P domain is further divided into the P1 and P2 subdomains. The surface-exposed P2 subdomain is thought to dictate binding to the cellular attachment factors, histo-blood group antigen (HGBA) carbohydrates (highlighted in green), while the S domain forms the core of the viral particle.Citation2 (c) The known variable antigenic sites (A, C, D, E, and G) located on the surface of the P2 subdomain of GII.4 norovirus are highlighted. The structural models were rendered using UCSF Chimera (version 1.11.2) and the following Protein Data Bank (PDB) files: 1IHM and 2ZLE (Norwalk virus, GI.1) and 2OBS (VA387 virus, GII.4 Grimsby variant). (d) Residues mapping on the variable antigenic sites of GII.4 noroviruses. Changes on these sites correlate with the emergence of GII.4 variants. (e) Amino acid variation in the P domain of the VP1 protein and its correlation with GII.4 variant distribution was quantified with Shannon entropy (left) and adjusted Rand index (right). Dataset includes sequences collected from 1995 to 2016, as described in Tohma et al., 2019.Citation70 Entropy values were calculated using the Shannon Entropy-One tool, as implemented in Los Alamos National Laboratory (www.hiv.lanl.gov) for six major GII.4 variants. The boxplot shows mean and standard deviation from each antigenic and non-antigenic site of major variants and all-in sequences that included a maximum of 50 randomly subsampled strain/variant to reduce sampling bias (n = 474). The dotted line indicates the mean of entropy values from non-antigenic sites in the subsampled all-in dataset. Adjusted Rand index, in which higher index values indicate a higher degree of correlation between variant distribution and the amino acid variation, was calculated with the subsampled all-in dataset using R and presented in a dot plot. Each circle represents the index from each antigenic and non-antigenic site

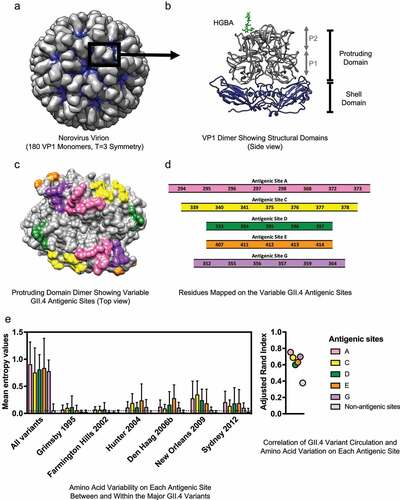
Table 1. Current and prospective human norovirus vaccines