3,702
Views
10
CrossRef citations to date
0
Altmetric
Research Paper

Infant gut microbiota modulation by human milk disaccharides in humanized microbiome mice

, , , , &
Article: 1914377 | Received 15 Oct 2020, Accepted 30 Mar 2021, Published online: 03 May 2021

Figures & data

Figure 1. Schematic representation of the experimental design. n = 5 mice in each group: untreated, antibiotic-treated, control, 3FN (fucosyl-α1,3-GlcNAc), 6FN (fucosyl-α1,6-GlcNAc), LNB (lacto-N-biose) and GNB (galacto-N-biose)
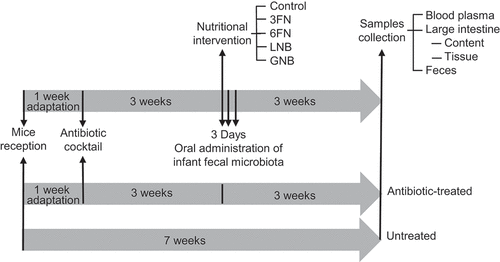
Figure 1. Schematic representation of the experimental design. n = 5 mice in each group: untreated, antibiotic-treated, control, 3FN (fucosyl-α1,3-GlcNAc), 6FN (fucosyl-α1,6-GlcNAc), LNB (lacto-N-biose) and GNB (galacto-N-biose)

Figure 2. Fecal microbial diversity of mice in response to antibiotic-treatment and infant fecal transplantation. Principal coordinates analysis (PCoA) plot of fecal microbiota composition using Bray–Curtis (a) and Jaccard (b) distance metrics. (c) Venn diagram of shared OTUs between the infant donor fecal mix and the fecal microbiota of the untreated, antibiotic-treated and control mice groups. FMT, fecal microbiota transplantation
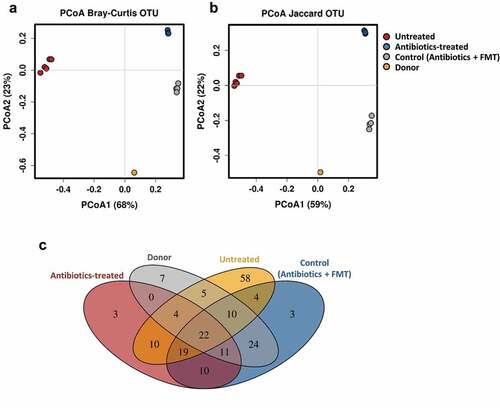
Figure 2. Fecal microbial diversity of mice in response to antibiotic-treatment and infant fecal transplantation. Principal coordinates analysis (PCoA) plot of fecal microbiota composition using Bray–Curtis (a) and Jaccard (b) distance metrics. (c) Venn diagram of shared OTUs between the infant donor fecal mix and the fecal microbiota of the untreated, antibiotic-treated and control mice groups. FMT, fecal microbiota transplantation

Figure 3. Fecal microbial diversity and richness of infant fecal transplanted mice in response to disaccharide-supplemented diets. Principal coordinates analysis (PCoA) plot of fecal microbiota composition using Bray–Curtis (a), Shannon index (b), Chao1 index (c) and absolute richness (d) at OTU level. Box plots present the median (interquartile range) and min/max. 3FN (fucosyl-α1,3-GlcNAc), 6FN (fucosyl-α1,6-GlcNAc), LNB (lacto-N-biose) and GNB (galacto-N-biose). Statistical significant differences compared to control are indicated: *p < 0.05; **p < 0.01; ***p < 0.001, ****p < 0.0001
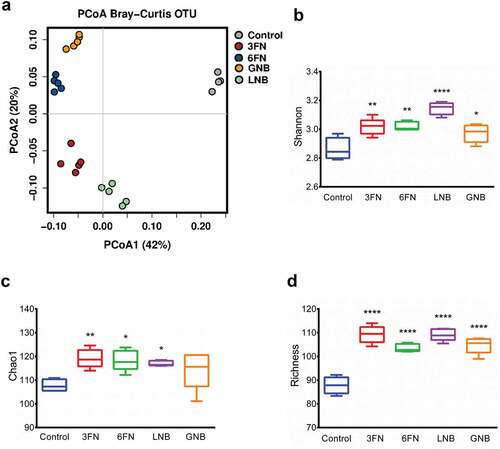
Figure 3. Fecal microbial diversity and richness of infant fecal transplanted mice in response to disaccharide-supplemented diets. Principal coordinates analysis (PCoA) plot of fecal microbiota composition using Bray–Curtis (a), Shannon index (b), Chao1 index (c) and absolute richness (d) at OTU level. Box plots present the median (interquartile range) and min/max. 3FN (fucosyl-α1,3-GlcNAc), 6FN (fucosyl-α1,6-GlcNAc), LNB (lacto-N-biose) and GNB (galacto-N-biose). Statistical significant differences compared to control are indicated: *p < 0.05; **p < 0.01; ***p < 0.001, ****p < 0.0001

Figure 4. Fecal microbial composition of infant fecal transplanted mice in response to disaccharide-supplemented diets. (a) Fecal microbial relative abundances at genus level. Bars represent each diet group and values are mean relative abundance of each bacterial genus. (b) Clustered bar-chart analysis of fecal mice samples at genus level. Bars represent each mouse. Control group (n = 4); diet groups (n = 5). 3FN (fucosyl-α1,3-GlcNAc), 6FN (fucosyl-α1,6-GlcNAc), LNB (lacto-N-biose) and GNB (galacto-N-biose)
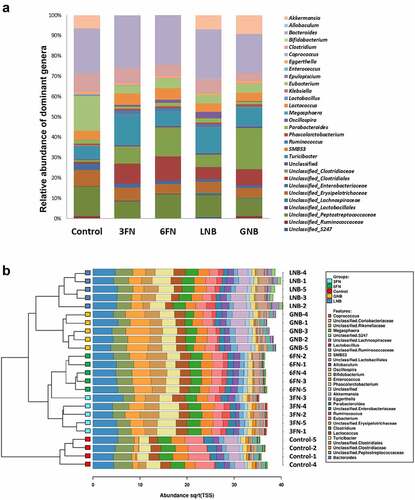
Figure 4. Fecal microbial composition of infant fecal transplanted mice in response to disaccharide-supplemented diets. (a) Fecal microbial relative abundances at genus level. Bars represent each diet group and values are mean relative abundance of each bacterial genus. (b) Clustered bar-chart analysis of fecal mice samples at genus level. Bars represent each mouse. Control group (n = 4); diet groups (n = 5). 3FN (fucosyl-α1,3-GlcNAc), 6FN (fucosyl-α1,6-GlcNAc), LNB (lacto-N-biose) and GNB (galacto-N-biose)

Figure 5. Abundances of the fecal bacterial genera that showed statistically significant differences for at least one of the disaccharide-supplemented mice groups compared to control group. 3FN (fucosyl-α1,3-GlcNAc), 6FN (fucosyl-α1,6-GlcNAc), LNB (lacto-N-biose) and GNB (galacto-N-biose). Box plots present the median (interquartile range) and min/max. n = 4 (control group); n = 5 (diet group). Statistical significant differences compared to control are indicated: #p < 0.1, *p < 0.05; **p < 0.01; ***p < 0.001, ****p < 0.0001
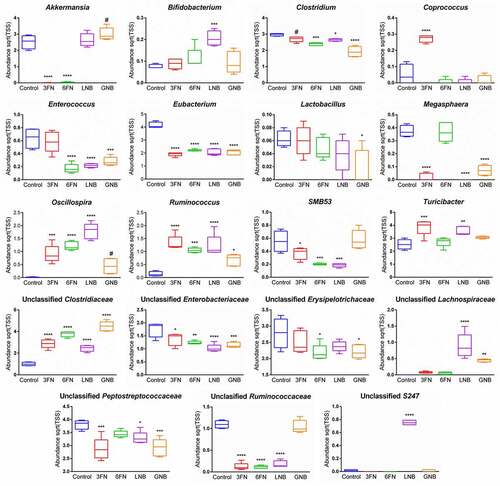
Figure 5. Abundances of the fecal bacterial genera that showed statistically significant differences for at least one of the disaccharide-supplemented mice groups compared to control group. 3FN (fucosyl-α1,3-GlcNAc), 6FN (fucosyl-α1,6-GlcNAc), LNB (lacto-N-biose) and GNB (galacto-N-biose). Box plots present the median (interquartile range) and min/max. n = 4 (control group); n = 5 (diet group). Statistical significant differences compared to control are indicated: #p < 0.1, *p < 0.05; **p < 0.01; ***p < 0.001, ****p < 0.0001

Figure 6. Venn diagram of shared OTUs between the infant donor fecal mix, the fecal microbiota of the control and fucosyl-oligosaccharides (a) or galactosyl-oligosaccharides (b) mice groups. 3FN (fucosyl-α1,3-GlcNAc), 6FN (fucosyl-α1,6-GlcNAc), LNB (lacto-N-biose) and GNB (galacto-N-biose)
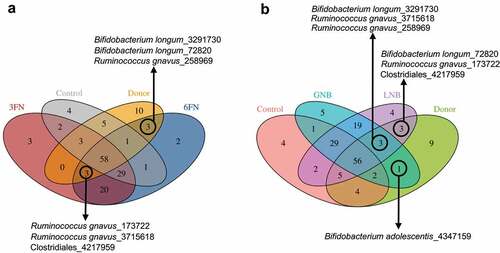
Figure 6. Venn diagram of shared OTUs between the infant donor fecal mix, the fecal microbiota of the control and fucosyl-oligosaccharides (a) or galactosyl-oligosaccharides (b) mice groups. 3FN (fucosyl-α1,3-GlcNAc), 6FN (fucosyl-α1,6-GlcNAc), LNB (lacto-N-biose) and GNB (galacto-N-biose)

Figure 7. Effect of 3FN (fucosyl-α1,3-GlcNAc), 6FN (fucosyl-α1,6-GlcNAc), LNB (lacto-N-biose) and GNB (galacto-N-biose) on short-chain fatty acid concentrations in large intestine content of infant fecal transplanted mice. Box plots present the median (interquartile range) and min/max. n = 5 (control group); n = 5 (diet groups). Statistical significant differences compared to control are indicated: *p < 0.05
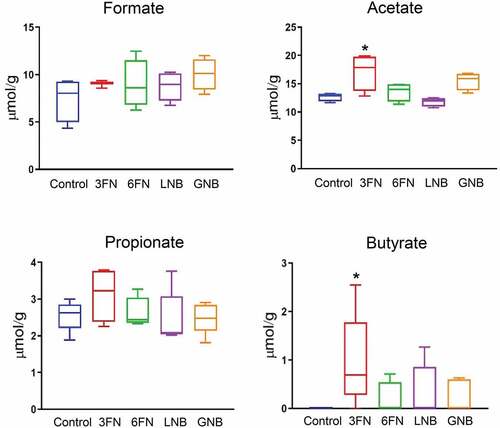
Figure 7. Effect of 3FN (fucosyl-α1,3-GlcNAc), 6FN (fucosyl-α1,6-GlcNAc), LNB (lacto-N-biose) and GNB (galacto-N-biose) on short-chain fatty acid concentrations in large intestine content of infant fecal transplanted mice. Box plots present the median (interquartile range) and min/max. n = 5 (control group); n = 5 (diet groups). Statistical significant differences compared to control are indicated: *p < 0.05

Figure 8. Effect of 3FN (fucosyl-α1,3-GlcNAc), 6FN (fucosyl-α1,6-GlcNAc), LNB (lacto-N-biose) and GNB (galacto-N-biose) on serum lipid profile of infant fecal transplanted mice. Box plots present the median (interquartile range) and min/max. n = 5 (control group); n = 5 (diet groups). Statistical significant differences compared to control are indicated: #p < 0.1, *p < 0.05; **p < 0.01
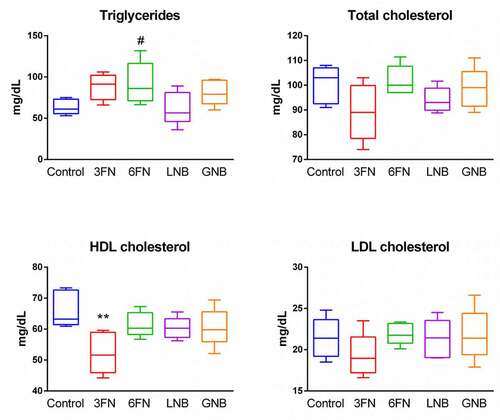
Figure 8. Effect of 3FN (fucosyl-α1,3-GlcNAc), 6FN (fucosyl-α1,6-GlcNAc), LNB (lacto-N-biose) and GNB (galacto-N-biose) on serum lipid profile of infant fecal transplanted mice. Box plots present the median (interquartile range) and min/max. n = 5 (control group); n = 5 (diet groups). Statistical significant differences compared to control are indicated: #p < 0.1, *p < 0.05; **p < 0.01

Figure 9. Effect of 3FN (fucosyl-α1,3-GlcNAc) (a), 6FN (fucosyl-α1,6-GlcNAc) (b), LNB (lacto-N-biose) (c) and GNB (galacto-N-biose) (d) on gene expression of cytokines and Toll-like receptors in the large intestine tissue of infant fecal transplanted mice. The values, expressed as fold-changes, represent relative expression in treated mice groups compared to control group. Box plots present the median (interquartile range) and min/max. n = 5 (control group); n = 5 (diet groups). Statistical significant differences compared to control are indicated: #p < 0.1, *p < 0.05
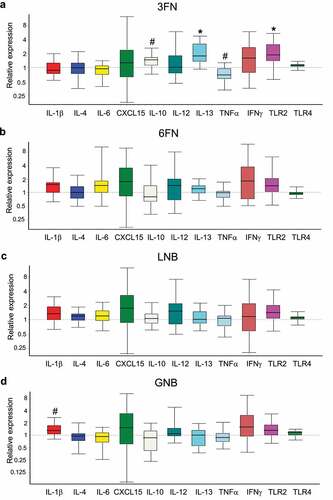
Figure 9. Effect of 3FN (fucosyl-α1,3-GlcNAc) (a), 6FN (fucosyl-α1,6-GlcNAc) (b), LNB (lacto-N-biose) (c) and GNB (galacto-N-biose) (d) on gene expression of cytokines and Toll-like receptors in the large intestine tissue of infant fecal transplanted mice. The values, expressed as fold-changes, represent relative expression in treated mice groups compared to control group. Box plots present the median (interquartile range) and min/max. n = 5 (control group); n = 5 (diet groups). Statistical significant differences compared to control are indicated: #p < 0.1, *p < 0.05
Supplemental material

Supplemental Material

Download Zip (371.9 KB)