Figures & data
Table 1. Details of Patients with Minimal Hepatic Encephalopathy on Psychometric Hepatic Encephalopathy Score (PHES) and on Inhibitory Control test (ICT) (N = 97)
Figure 1. Bacterial species comparison between patients with MHEPHES (n = 47) versus not (n = 50)1A: Alpha diversity analyses did not show any differences between groups 1B: Cleveland plot derived from DESeq2 comparison 1 C: PCoA showing no significant separation between groups (PERMANOVA not significant)
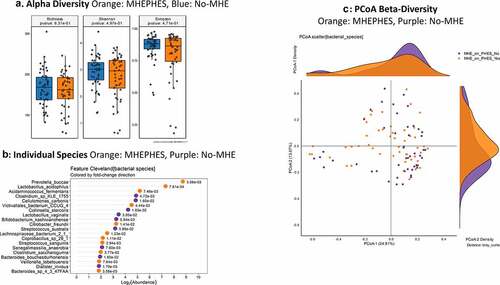
Table 2. MAAsLin2 Top 30 Bacterial Species and Clinical Variables associated with MHE on Individual tests
Table 3. MAAsLin2 Top 30 Bacterial Species and Clinical Variables
Table 4. Comparison of Gut-Brain Modules Different in Patients According to Cognitive Strategy used
Figure 2. Gut brain module comparison between patients with MHEPHES (n = 47) versus not (n = 50) 1A: Alpha diversity analyses did not show any differences between groups 1B: Cleveland plot derived from Metastats comparison 1 C: PCoA showing no significant separation between groups (PERMANOVA not significant)
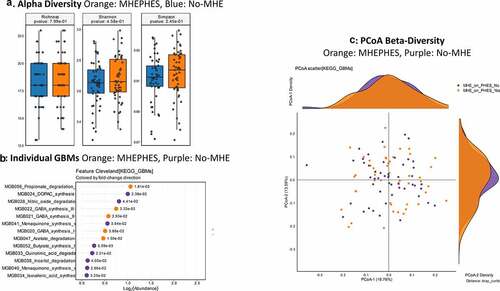
Figure 3. Bacterial species comparison between patients with MHEICT (n = 76) versus not (n = 21) 1A: Alpha diversity analyses did not show any differences between groups 1B: Cleveland plot derived from DESeq2 comparison 1 C: PCoA showing trend toward a significant separation between groups (PERMANOVA p = .08)
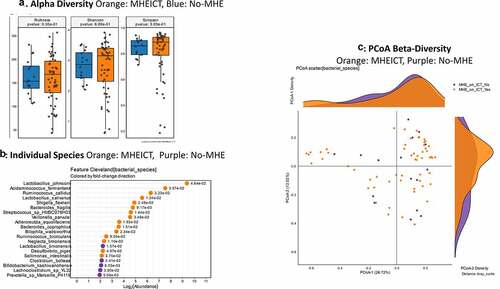
Figure 4. Gut brain module comparison between patients with MHEICT (n = 76) versus not (n = 21)1A: Alpha diversity analyses showed significantly higher diversity in the MHEICT group compared to no-MHE 1B: Cleveland plot derived from Metastats comparison 1 C: PCoA showing a significant separation between groups
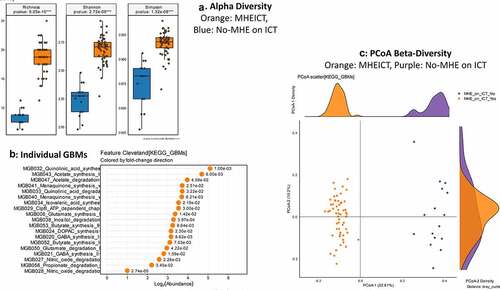
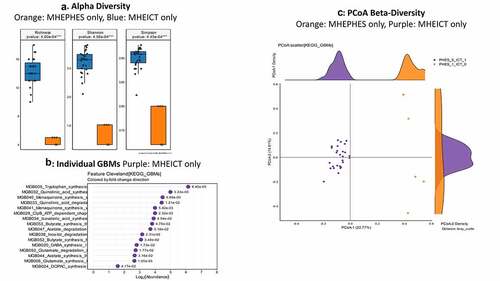
Figure 5. Bacterial species comparison between patients with MHEICT-only (n = 35) versus MHEPHES only (n = 6)1A: Alpha diversity analyses did not show any differences between groups 1B: Cleveland plot derived from DESeq2 comparison 1 C: PCoA showing no significant separation between groups
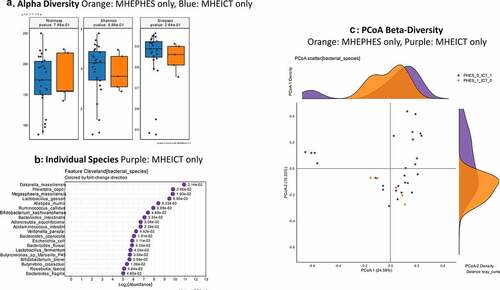
Figure 6. Gut brain module comparison between patients with MHEICT-only (n = 35) versus MHEPHES only (n = 6) 1A: Alpha diversity analyses showed significantly higher diversity in the MHEICT only group compared to MHEPHES only group 1B: Cleveland plot derived from Metastats comparison 1 C: PCoA showing a significant separation between groups