Figures & data
Figure 1. Characterization of the recombinant L. reuteri CO21 strain producing LFCA (LR-LFCA) and LFCA produced by LR-LFCA is bioactive. Protein production and secretion were analyzed by western blotting, which resolved LFCA as an immunoreactive 4.6 kDa band (panel A), and ELISA (panels B). LR-LFCA and LR-con were cultured for 24 h, and LFCA levels were assayed in the cell lysates and 20-fold TCA-concentrated culture supernatant. 1: The culture supernatant of LR-LFCA, 2: the cell lysates of LR-LFCA, 3: the culture supernatant of LR-CON, 4: the cell lysates of LR-CON. Dotted lines separated the lanes, and irrelevant lanes were omitted. (c) Bar graph showing the effects of lysates (5 µg protein) from LR-LFCA cells on the growth of S. aureus CVCC25923, ETEC K88, P. multocida ATCC43137 and S. enteritidis ATCC50335. (d) Ultrastructural damage in bacteria treated with cell lysates (5 µg protein) from LR-LFCA. Control, bacteria treated with PBS; LR-con, bacteria treated with cell lysates from LR-con; LR-LFCA, bacteria treated with cell lysates from LR-LFCA. Cells were analyzed by electron microscopy. Data are presented as the means ± SD of three independent replicates.
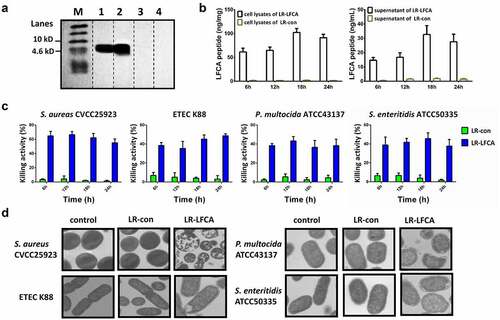
Figure 2. The effect of oral administration LR-LFCA on the intestinal morphology and the intestinal epithelial mucosa. (a, b) Western blot measurements of the expression levels of tight junction proteins (including ZO-1 and Claudin-2) in the jejunum and ileum of piglets. (c, d) Relative mRNA expression levels of ZO-1 and Claudin-2 in the jejunum and ileum mucosa determined by Realtime-PCR. (e) The serum D-lactic acid and endotoxin levels of piglets. (f) Growth performance of the piglets. (g) The levels of serum IgG. (h) The level of secretory IgA in jejunum and ileum. (i, j) Representative images of the jejunum and ileum stained with H&E (scale bar, 100 µm). (k, l) The crypt depth, villous height and villus height/crypt depth of the jejunum and ileum were measured. F-CON, the first week after oral administration of PBS; F-LR-con, the first week after oral administration of LR-con; F-LR-LFCA, the first week after oral administration of LR-LFCA; S-CON, the second week after oral administration of PBS; S-LR-con, the second week after oral administration of LR-con; S-LR-LFCA, the second week after oral administration of LR-LFCA; T-CON, the third week after oral administration of PBS; T-LR-con, the third week after oral administration of LR-con; T-LR-LFCA, the third week after oral administration of LR-LFCA. Data are represented as mean ± SD, *p < .05, **p < .01 vs. the CON group; #p < .05 and ##p < .01 vs. the LR-LFCA group.
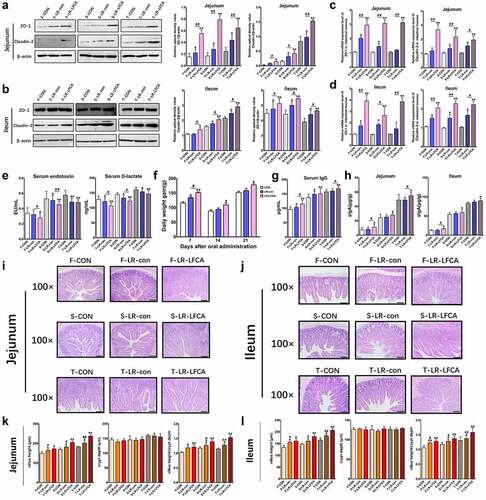
Figure 3. The changes of intestinal microbial diversities in piglets with oral administration of LR-LFCA. (a) Chao 1 index. (b) Shannon index. (c) Principal coordinates analysis (PCoA) of the operational taxonomic units in the piglet cecum contents. (d) β-Diversity between groups was analyzed by weighted UniFrac distance. Microbial community bar plot at the (e) phylum level and (f) genus level. F-CON, the first week after oral administration of PBS; F-LR-con, the first week after oral administration of LR-con; F-LR-LFCA, the first week after oral administration of LR-LFCA; S-CON, the second week after oral administration of PBS; S-LR-con, the second week after oral administration of LR-con; S-LR-LFCA, the second week after oral administration of LR-LFCA; T-CON, the third week after oral administration of PBS; T-LR-con, the third week after oral administration of LR-con; T-LR-LFCA, the third week after oral administration of LR-LFCA. Data are presented as mean ± SD. *p < .05, **p < .01 vs. CON; #p < .05 and ##p < .01 vs. the LR-LFCA group.
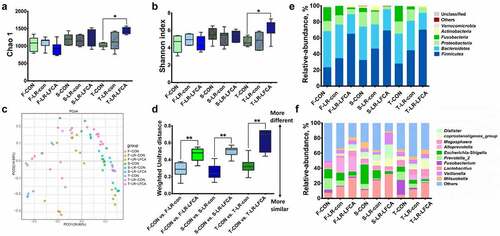
Figure 4. Effect of oral administration LR-LFCA to newborn piglets on intestinal morphology after ETEC K88 challenge. (a) Bodyweight changes of piglets. (b) Diarrhea incidence of piglets. (c) The concentration of ETEC-specific IgG in serum and ETEC-specific SIgA in jejunum and ileum mucosa. (d, e) Intestinal morphology of jejunum and ileum shown by H&E staining and scanning electronic microscope. Data are presented as mean ± SD. *p < .05, **p < .01 vs. CON; #p < .05 and ##p < .01 vs. the ETEC+LR-LFCA group.
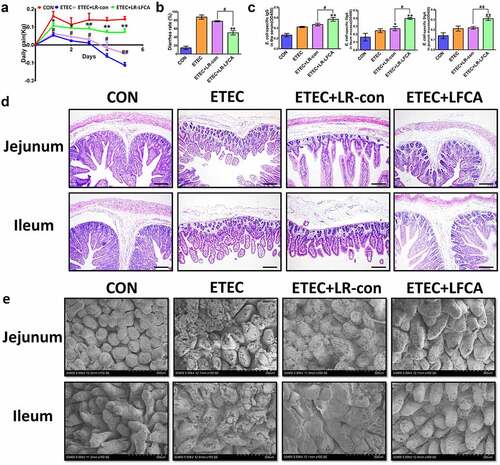
Figure 5. The expression of intestinal tight junction proteins after ETEC K88 challenge. (a) Immunofluorescence staining for ZO-1 and Claudin-2 in ileum of piglets. (b) The relative mRNA expression of TLR-4, Myd88, and MLCK in ileum of piglets, detected using real-time PCR. (c) The contents of ZO-1, Claudin-2, TLR-4, Myd88, and MLCK in ileum of piglets were determined by Western blot analysis. Data are presented as mean ± SD. *p < .05, **p < .01 vs. CON; #p < .05 and ##p < .01 vs. the ETEC+LR-LFCA group.
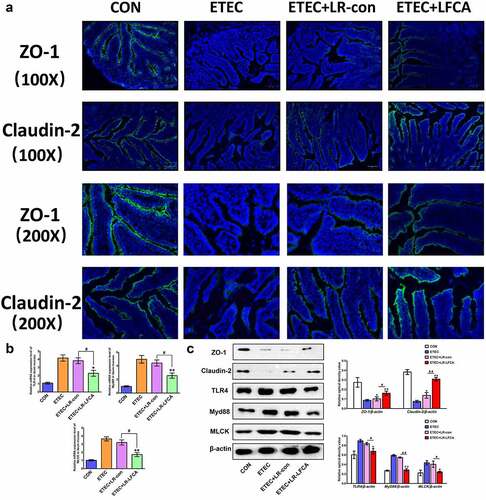
Figure 6. Effects of oral administration LR-LFCA to newborn piglets on oxidative stress and inflammatory factors changes in intestine mucosa of piglets after ETEC K88 challenge. (a) IL-1β, IL-12, IL-6, TNF-α and IL-10 levels in jejunum; (b) IL-1β, IL-12, IL-6, TNF-α and IL-10 levels in ileum, all of them were determined by ELISA. (c) The expression of CD40 and MHC II in dendritic cells in Peyer’s patch of piglets (d) The transcription levels of dendritic cells CD80 and CD86 in Peyer’s patch of piglets (e) Nuclear Nrf2 and HO-1 levels were assessed by western blotting. (f) MDA production; SOD activity changes; T-AOC activity changes; CAT activity changes; GSH-Px activity changes. Data are presented as mean ± SD. *p < .05, **p < .01 vs. ETEC; #p < .05 and ##p < .01 vs. the ETEC+LR-LFCA group.
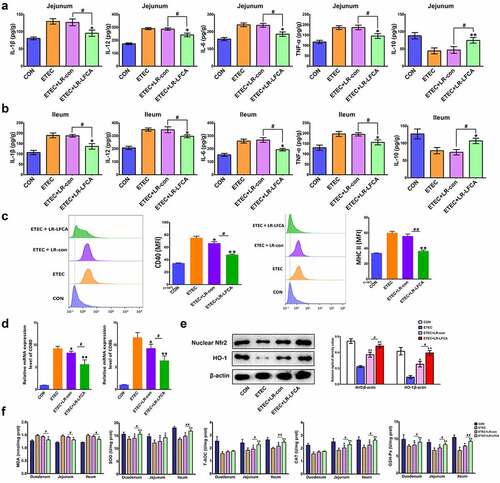
Figure 7. The anti-inflammatory and antioxidant mechanism of LR-LFCA. (a) IL-1β, IL-6 and TNF-α levels in LPS-induced IPEC-J2 cells were determined by ELISA. (b) Western blot analysis of p65, p-p65, IκB-α, p-IκB-α, lamin B, and β-actin. (c) CD80 and CD86 levels on the surface of LPS-induced MoDCs cells were determined by flow cytometry. (d) The mRNA expression of CD80 and CD86 on the surface of LPS-induced MoDCs cells were determined by Real-time PCR Data are means ± SD. (e) The MoDCs phagocytic ability was determined by neutral red. (f) The ability of LPS-stimulated MoDCs to mediate CD4 + T cell proliferation was determined by CCK-8. (g) The release rate of LDH in IPEC-J2 cells stimulated by H2O2. (h) The contents of reactive oxygen species in H2O2-stimulated IPEC-J2 cells were determined by flow cytometry, and the average fluorescence intensity of DCF were analyzed. (i) Western blot analysis of the protein expression levels of Nrf2 and HO-1 in IPEC-J2 cells. *p < .05, **p < .01 vs. the CON group; #p < .05 and ##p < .01 vs. the LR-LFCA group.

Figure 8. The effects of LR-LFCA on LPS-induced barrier dysfunction in vitro. (a) Immunofluorescence localization of ZO-1 and Claudin-2 in IPEC-J2 cells. (b) The mRNA expression of ZO-1 and Claudin-2 assessed by real-time PCR. (c) Content of ZO-1 and Claudin-2 in IPEC-1 cells with ML-7 treatment. (d) Content of MLCK in IPEC-J2 cells with siRNA-induced knock-down of TLR4 and MyD88. (e) The contents of TLR-4, Myd88, and MLCK in IPEC-J2 cells were determined by Western blot analysis. (f) The relative mRNA expression of TLR-4, Myd88, and MLCK in IPEC-J2 cells, detected using real-time PCR. Data are presented as mean ± SD. *p < .05, **p < .01 vs. CON; #p < .05 and ##p < .01 vs. the LPS+LR-LFCA group.
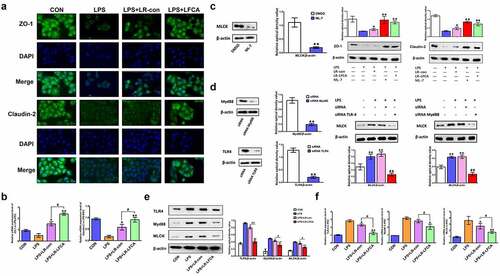
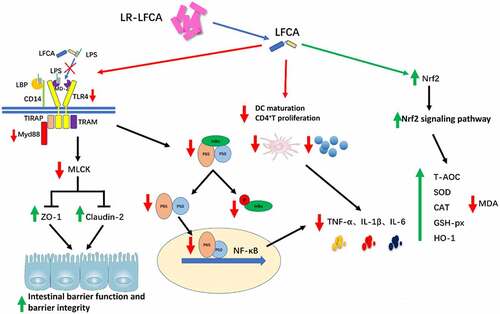
Figure 9. LR-LFCA regulates intestinal mucosal immune mechanism.