Figures & data
Table 1. Pathway and biological function enrichment analysis of differentially expressed genes
Figure 1. Differential expression analysis of Escherichia coli Nissle reveals upregulation of flagella and formate hydrogenlyase genes in response to colitis. (a) Heatmap of the differentially expressed genes of E. coli Nissle between DSS-treated mice and untreated (control) mice. There are 187 differentially expressed genes; 119 upregulated and 68 downregulated genes clustered based on similarity. The cutoff set for differential expression were log2 fold change over 1.0 and FDR-adjusted p-values under 0.05. Each column represents samples from either DSS treated mice (5 samples) or control mice (3 samples) clustered based on similarity. Red indicates relative overexpression and blue indicates relative repression. (b) Tables highlighting results of differential expression analysis on the top upregulated/downregulated genes in response to colitis as well as genes associated with flagella assembly and formate hydrogenlyase activity. Functions related to gene symbol was retrieved from the BioCyc online database.Citation23 Log2 fold change (Log2FC) and associated p value are listed for every gene listed. Genes in bold were also validated by qRT-PCR in the subsequent section. Flagella genes (yellow) and formate hydrogen lyase genes (red) are highlighted on the heatmap. “ Formate hydrogenlyase gene hycB is listed in the top three upregulated genes table instead of the formate hydrogenlyase genes table
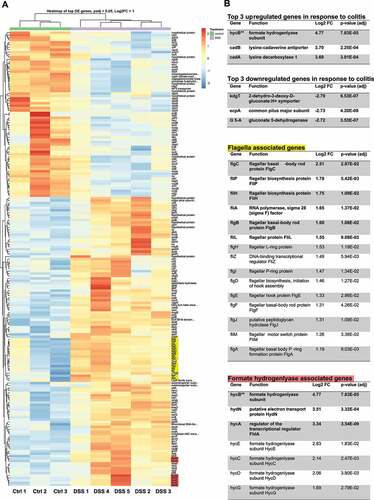
Figure 2. Confirming differential expression of E. coli Nissle genes associated with flagella assembly and formate hydrogenlyase activity in DSS-treated mouse by qRT-PCR. (a) Validation of differential expression of top three upregulated and downregulated genes, (b) genes associated with flagella assembly, (c) genes associated with formate hydrogenlyase activity, and (d) genes involved in dipeptide transportation. RNA was recovered from mouse stool samples colonized with E. coli Nissle of an independently replicated experiment (N = 4 per treatment group). Extracted RNA was converted into cDNA and relative expression levels of target genes was accessed by qRT-PCR with specific primers previously validated for specificity and amplification efficiency against genomic DNA of E. coli Nissle. Gene expression for each target was normalized to the geometric mean of two independent housekeeping genes: 16S rRNA and cysG. Fold increase (or fold decrease as a negative number) between DSS-treated and untreated (control) mice are indicated above each mean as well as the result of Student t-test (* = p value<.05, n.s. = not significant)
Figure 3. Nitric oxide stress alone is not sufficient to increase the transcription of flagella biosynthesis genes and formate hydrogenlyase genes in E. coli Nissle. Cultures of E. coli Nissle were grown in triplicate to their logarithmic growth phase (LB media, 37°C, 220 rpm) and subjected to nitric oxide stress by addition of 100 µM of a nitric oxide donor, spermine NONOate, for 1 h. Pellets were harvested and RNA was extracted for qRT-PCR. Gene expression for each target was normalized to the geometric mean of two independent housekeeping genes: 16S rRNA and cysG. Fold increase (or fold decrease as a negative number) between NONOate-treated and untreated (control) cells are indicated above each mean as well as the result of Student t-test (* = p value<.05, n.s. = not significant)