Figures & data
Figure 1. SOD1G93A mice have slow intestinal mobility, decreased rotarod test time and grip strength during ALS progression. (a) SOD1G93A mice significantly increased gut transit time starting at 2-month-old compared to WT mice. In age-matched WT and SOD1G93A mice, intestinal mobility was tested using Evans blue marker (5% Evans blue, 5% gum Arabic in drinking water). (Data are expressed as mean ± SD. n = 6, two-way ANOVA test, ***P < .001, adjusted by the Tukey method). (b) Starting at 2-month-old, SOD1G93A mice had significant reduced rotarod test time compared to WT mice. (Data are expressed as mean ± SD. n = 6, two-way ANOVA test, *P < .05, **P < .01, ***P < .001, adjusted by the Tukey method). (c) Forelimb grip strength in WT and SOD1G93A mice at different time points and (d) Hindlimb grip strength in WT and SOD1G93A mice at different time points. (Data are expressed as mean ± SD. n = 6, two-way ANOVA test, *P < .05, **P < .01, ***P < .001, adjusted by the Tukey method). (e) At the age of 2 months old, the expression of SMMHC protein started to decrease while the expression of GFAP protein started to increase in age matched SOD1G93A mice compared to WT mice, and (f) and (g) Quantification for the expression of SMMHC and GFAP proteins in different time points. (Data are expressed as mean ± SD. n = 6, Kruskal-Wallis test with pairwise comparisons using Wilcoxon rank sum exact test, *P < .05, ***P < .01, ***P < .001 adjusted by the FDR method)
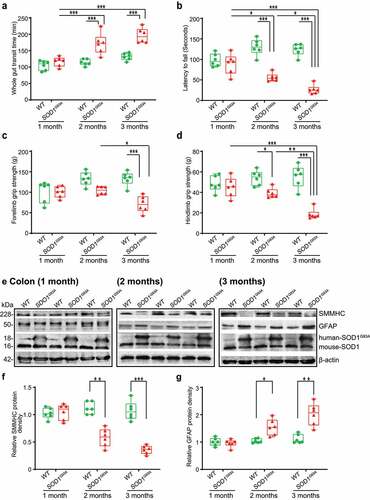
Figure 2. Defects in the enteric nervous system structure in the SOD1G93A mice starting at 2-month-old. (a) SMMHC started decrease at 2-month-old in the colon of the SOD1G93A mice compared to the aged-match WT mice in immunofluorescence staining and quantification of SMMHC staining. There is no change of alpha-smooth muscle actin in immunofluorescence staining. Images are from a single experiment representative of 6 mice per group. (Data are expressed as mean ± SD. n = 6, two-way ANOVA test, **P < .01, ***P < .001, adjusted by the Tukey method). (b) GFAP started to increase at 2-month-old in the colon of the SOD1G93A mice compared to the age-matched WT mice in immunofluorescence staining and quantification of GFAP staining. Images are from a single experiment, representative of 6 mice per group. (Data are expressed as mean ± SD. n = 6, Kruskal-Wallis test, ***P < .01, ***P < .001, adjusted by the FDR method). (c) PGP9.5 was also enhanced in the SOD1G93A mice at 2-month-old in the colon of the SOD1G93A mice compared to the age-matched WT mice in immunofluorescence staining and quantification of PGP9.5 staining. Images are from a single experiment, representative of 6 mice per group. (Data are expressed as mean ± SD. n = 6, two-way ANOVA test, ***P < .001). (d) Aggregation of human-SOD1G93A protein was observed starting from 2-month-old SOD1G93A mice compared to the age-matched WT mice in immunofluorescence staining and human-SOD1 protein aggregates percentage analysis. Images are from a single experiment, representative of 6 mice per group. (Data are expressed as mean ± SD. n = 6, Kruskal-Wallis test with pairwise comparisons using Wilcoxon rank sum exact test, **P < .01, ***P < .001, adjusted by the FDR method)
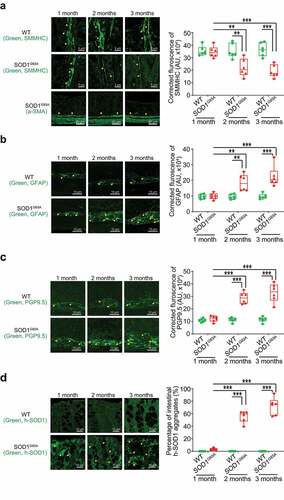
Figure 3. Human SOD1G93A protein was aggregated, and GFAP protein was increased during ALS progression. Aggregation of human-SOD1G93A protein was observed in the lumbar spine white matter (a) and gray matter (b) starting in 2-month-old SOD1G93A mice in immunofluorescence staining, immunohistochemistry staining and human-SOD1 protein aggregates percentage analysis. Images are from a single experiment, representative of 6 mice per group. (Data are expressed as mean ± SD. n = 6, one-way ANOVA test, *P < .05, **P < .01, ***P < .001). GFAP expression was enhanced starting from 2-month-old in the lumbar spine white matter (c) and gray matter (d) in the SOD1G93A mice in immunofluorescence staining, immunohistochemistry staining and GFAP staining quantification. Images are from a single experiment, representative of 6 mice per group. (Data are expressed as mean ± SD. n = 6, one-way ANOVA test, *P < .05, **P < .01, ***P < .001)
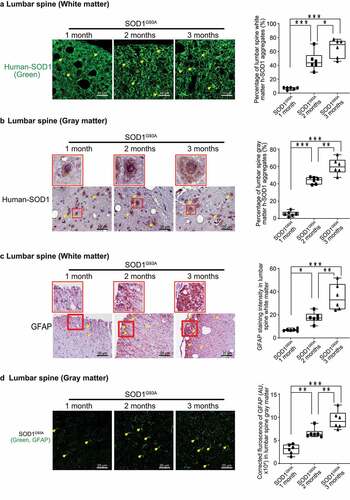
Figure 4. Association of altered ENS and increased aggregation of human-SOD1G93A in the SOD1G93A mice in longitudinal studies. (a) The correlation analysis between intestinal mobility (Whole gut transit time) and latency to fall, forelimb grip strength; staining intensity of GFAP, aggregation of human SOD1G93A protein respectively in the 2-month-old SOD1G93A, compared with WT mice. (P values are labeled in figures, n = 6). Slow Intestinal mobility links with decreased forelimb grip strength, increased staining intensity of GFAP, increased aggregation of human SOD1G93A protein respectively in 2-month-old SOD1G93A. (b) The correlation analysis between aggregation of human SOD1G93A protein and latency to fall and staining intensity of SMMHC in 2-month-old SOD1G93A, compared with WT mice. (P values are labeled in figures, n = 6). Increased aggregation of human SOD1G93A protein links with decreased muscle strength and decreased SMMHC in the 2-month-old SOD1G93A. (c) The correlation analysis between staining intensity of SMMHC and staining intensity of GFAP, staining intensity of PGP9.5 protein respectively in the 2-month-old SOD1G93A, compared with WT mice. (P values are labeled in figures, n = 6). Decreased staining intensity of SMMHC links with increased staining intensity of GFAP and PGP9.5 respectively in the 2-month-old SOD1G93A, compared with WT mice
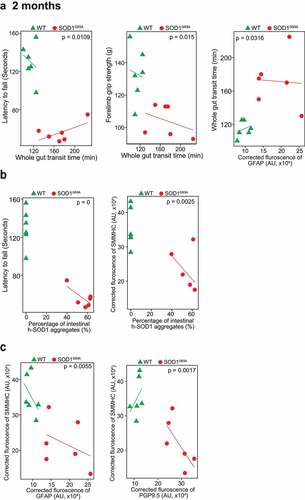
Figure 5. Butyrate treatment led to reduced human-SOD1G93A aggregation, and enhanced ENS and muscle function in intestine and neurons of SOD1G93A mice. (a) Body weight changes of SOD1G93A mice after butyrate treatment. Male or female SOD1G93A mice were treated with or without 2% butyrate in the drinking water starting from 63 days (2.1 months) to 101 days (3.4 months). Butyrate treated SOD1G93A mice started to show less weight loss from the age of 83 days (1.4 months), compared to the no-treatment SOD1G93A mice. Each data point represents the average body weight. (Data are expressed as mean ± SD. n = 6–10, two-way ANOVA test, *P < .05). (b) SOD1G93A mice with butyrate treatment showed a significantly increased rotarod test time. At age 14–15 weeks, the mice were subjected to the trial on the accelerating spindle (4 to 40 rpm) for 300 seconds. Latency to fall was recorded when the mouse fell from the rod. Each mouse was tested in 4 trials per day for 2 consecutive days. The mean times for 8 trials of the tests were calculated for each mouse. (Data are expressed as mean ± SD. n = 6–10, Welch’s t-test, *P < .05). (c) Butyrate treatment led to increased SMMHC and decreased GFAP expression in SOD1G93A mice. (Data are expressed as mean ± SD. n = 4, student t-test, **P < .01). (d) Reduced human-SOD1G93A aggregation, decreased GFAP expression and enhanced SMMHC expression in intestine of SOD1G93A mice with butyrate treatment. Images are from a single experiment and are representative of 5 mice per group. (Data are expressed as mean ± SD. n = 5, Welch’s t-test, *P < .05). (e) Reduced human-SOD1G93A aggregation in lumbar spine of SOD1G93A mice with butyrate treatment. Images are from a single experiment and are representative of 5 mice per group. (Data are expressed as mean ± SD. n = 5, Welch’s t-test, *P < .05).(f) Decreased GFAP expression in lumbar spine of SOD1G93A mice with butyrate treatment. Images are from a single experiment and are representative of 5 mice per group. (Data are expressed as mean ± SD. n = 5, Welch’s t-test, *P < .05)
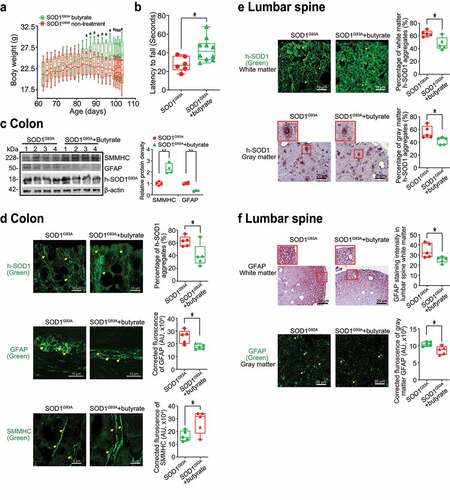
Figure 6. Antibiotics treatment led to reduced human-SOD1G93A aggregation, and enhanced ENS and muscle function in intestine and neurons of SOD1G93A mice. (a) Body weight changes of SOD1G93A mice treated with antibiotics. Male or female SOD1G93A mice were treated with or without antibiotics (1 mg/ml metronidazole and 0.3 mg/ml clindamycin) in the drinking water starting from 48 days (1.6 months) to 107 days (3.6 months). Antibiotic treated SOD1G93A mice started to show less weight loss at the age of 91 days, compared to the non-treatment SOD1G93A mice. Each data point represents the average body weight. (Data are expressed as mean ± SEM. n = 8–11, two-way ANOVA test, *P < .05). (b) SOD1G93A mice with antibiotics treatment showed a significantly increased time in the rotarod test. At 15–16 weeks old, the mice were subjected to the trial on the accelerating spindle (4 to 40 rpm) for 300 seconds. Latency to fall was recorded when the mouse fell from the rod. Each mouse was tested in 4 trials per day for 2 consecutive days. The mean times for 8 trials of the tests were calculated for each mouse. (Data are expressed as mean ± SD. n = 8–11, Welch’s t-test, *P < .05). (c) Antibiotics treatment led to increased SMMHC and decreased GFAP expression in SOD1G93A mice. (Data are expressed as mean ± SD. n = 4, student t-test, *P < .05, **P < .01). (d) Reduced human-SOD1G93A aggregation, decreased GFAP expression and enhanced SMMHC expression in intestine of SOD1G93A mice treatment with antibiotic. Images are from a single experiment and are representative of 5 mice per group. (Data are expressed as mean ± SD. n = 5, Welch’s t-test, *P < .05). (e) Reduced human-SOD1G93A aggregation in lumbar spine of SOD1G93A mice treatment with antibiotics. Images are from a single experiment and are representative of 5 mice per group. (Data are expressed as mean ± SD. n = 5, Welch’s t-test, *P < .05). (f) Decreased GFAP expression in lumbar spine of SOD1G93A mice treatment with antibiotics. Images are from a single experiment and are representative of 5 mice per group. (Data are expressed as mean ± SD. n = 5, Welch’s t-test, *P < .05)
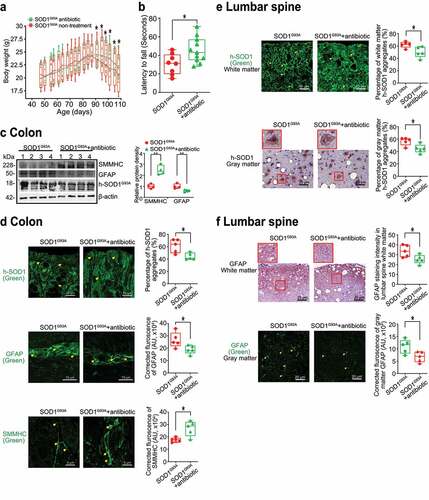
Figure 7. Increased aggregation of SOD1 mutant protein in human colonoids transfected with SOD1G93A-GFP plasmids and then colonized with SOD1G93A or WT mice feces. (a) Human colonoids were transfected with SOD1G93A-GFP plasmids after 48 hours and treated with feces from SOD1G93A/WT mice at different ages for 2 hours. After 2-hour treatment of mice feces, the phenotype of human colonoids, e.g., shape and buds did not change. Images are representative of experiments in triplicate. (b) Human SOD1 expression in human colonoids were transfected with SOD1G93A-GFP plasmids and then colonized with feces from SOD1G93A or WT mice. Images are representative of experiments in triplicate. (c) More SOD1G93A protein aggregations in the human colonoids after SOD1G93A-GFP plasmid transfection and 2 and 3-month-old SOD1G93A mice feces colonization. (Data are expressed as mean ± SD. n = 5, one-way ANOVA test, ***P < .001)
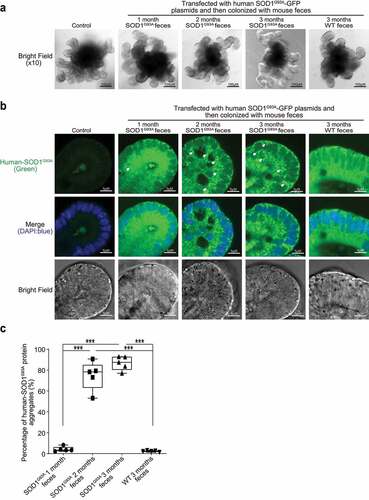
Table 1. Bacteria species identified by the longitudinal study of SOD1G93A mice and age-matched WT mice [the adjusted p-values (adj-p) associated comparing group, time, and group and time interaction]
Figure 8. Fecal microbiome changes in SOD1G93A mice. (a) Enterohabdus Muris started increasing in 2-month-old SODG93A, and then significantly enhanced in 3-month-old SOD1G93A mice, compared with WT mice. (n = 5, two-way Kruskal-Wallis rank sum test, ***P < .05 adjusted by FDR.). (b) Staphylococcus. Sp. UAsDu23 started increase in 2-month-old SODG93A, compared with 1-month-old SODG93A mice, and then significantly enhanced in 3-month-old SOD1G93A mice, compared with WT mice. (n = 5, Welch’s t-test, *P < .05). (c) Clostridium sp. ASF502 enhanced in 1 months SODG93A, compared with WT mice (n = 5, Welch’s t-test, *P < .05). (d) Bacteroides acidifaciens significantly enhanced in 3-month-old SOD1G93A mice, compared with the WT mice. (n = 5, two-way ANOVA test, *P < .05, adjusted by the Tukey method)
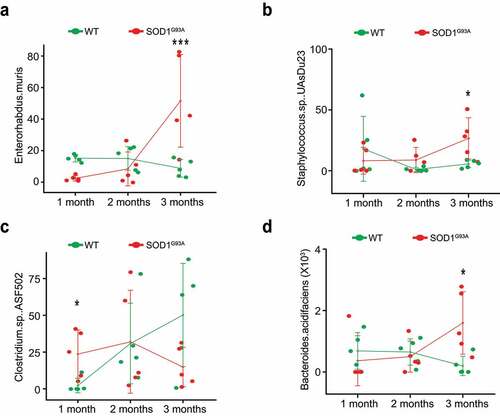
Table 2. Species identified by the longitudinal study in SOD1G93A mice and age-matched WT mice with butyrate treatment [the adjusted p-values (adj-p) associated comparing group, time, and group and time interaction]
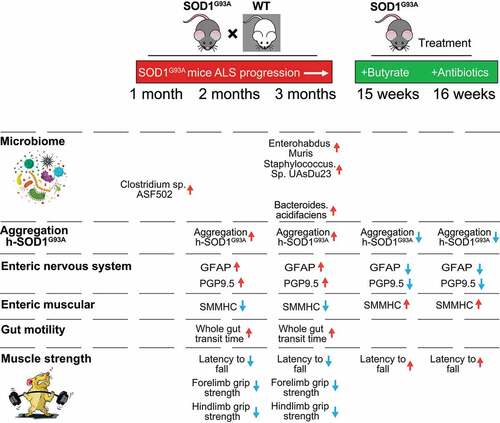
Figure 9. Timeline of altered microbiome, SOD1G93A aggregation, EN function, and lumbar spine pathophysiological in the progression of SOD1G93A ALS mice