Figures & data
Figure 1. Male C57BL/6 mice treated with different antibiotics exhibited altered sensitivity to ConA-induced hepatitis. (a) H&E staining of liver sections and corresponding sizes of necrotic areas are shown from mice 12 h after ConA administration (n = 8 mice per group). (b) Serum ALT levels were measured at the indicated time points (n = 8 mice per group). (c) Body weight changes of mice after antibiotic treatment (n = 8 mice per group). (d, e) Representative image showing the mouse cecum (n = 3–5). (f) H&E-stained colonic tissue sections 8 h after ConA administration. (g) FITC-dextran fluorescence intensity in the serum of mice (n = 8 mice per group). Short horizontal lines indicate means. The data from two independent experiments were combined. *Black represents Vehicle vs. Gen. *Red represents Van vs. Gen. *P < .05, **P < .01, ***P < .001. ns, not significant (t test). Scale bars, 100 μm (a, f).
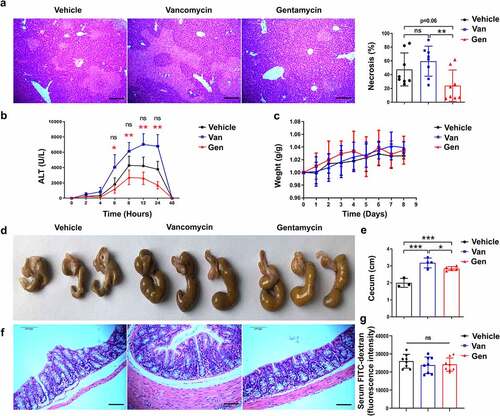
Figure 2. Antibiotic treatment altered the composition of the gut microbiota. 16S rRNA sequencing analysis of fecal DNA isolated from mice treated with antibiotics was performed (n = 6–8 mice per group). (a, b) Firmicutes/Bacteroidetes ratio and Proteobacteria/Bacteroidetes ratio. (c) Alpha diversity analysis. (d) Principal coordinates analysis. (e) Relative abundance of significantly altered taxa at the phylum level, including unspecified taxa. (f) Heatmap of the relative abundance of significantly altered taxa at the genus level. (g) Relative abundance of significantly altered taxa at the species level, including unspecified taxa. (h) Species with significantly increased abundance in Gen-treated mice (top 5) and Van-treated mice (top 1) are shown. The bars represent the means ± s.d. Statistical analyses: t test. *P < .05, ***P < .001. ns, not significant. See also Supplementary Figure S2.
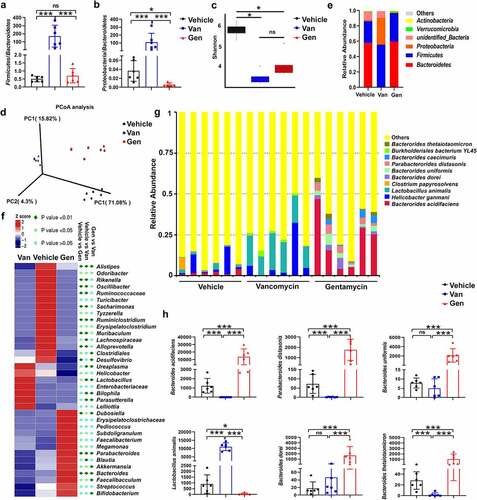
Figure 3. Susceptibility to ConA-induced liver injury was regulated by symbiotic bacteria. (a) Experimental strategy. (b) Microbiota-depleted recipient mice were transplanted with feces from donor mice. Serum ALT levels were measured 12 h after ConA administration (n = 6–8 mice per group). (c, d, e, f) Representative H&E and TUNEL staining of liver sections and corresponding sizes of necrotic areas from mice 12 h after ConA administration are shown (n = 6–8 mice per group). (g) Serum ALT levels and H&E staining necrosis of liver sections from Van- and Gen-treated mice treated with or without Abx 12 h after ConA administration (n = 5–8 mice per group). Statistical analyses: Student’s unpaired t test. *P < .05, ***P < .001. ns, not significant. Scale bars, 200 μm (e), 100 μm (f), 200 μm (g).
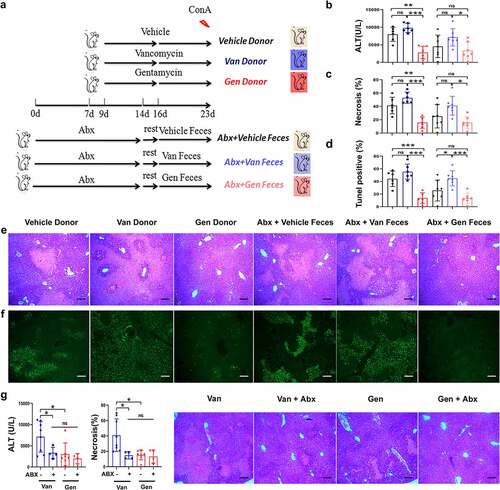
Figure 4. The difference in liver injury of gut microbiota-reconstituted mice was independent of IFN-γ and TNF-α. (a) IFN-γ and TNF-α cytokine profiles in the serum of Van- or Gen-treated mice 2 h, 4 h, 6 h, 8 h, 12 h, and 24 h after ConA injection (n = 8 mice per group). (b) Abx-treated recipient mice were transplanted with fecal bacteria from donor mice. IFN-γ and TNF-α levels were measured 12 h after ConA administration (n = 6–8 mice per group). ns, not significant (t test).
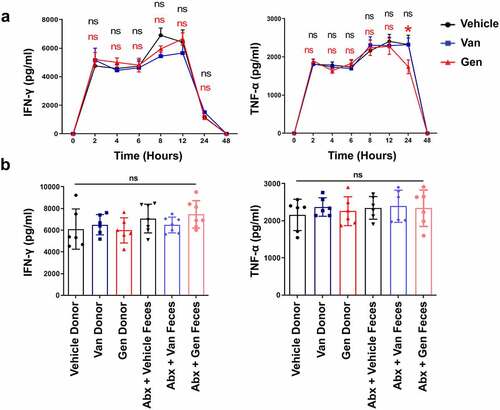
Figure 5. Van- and Gen-induced sensitivity alterations to liver injury in mice were CD95-mediated apoptosis dependent. TUNEL assay (a) and IHC staining of CD95 (b) in liver sections 12 h after ConA injection (n = 9 mice per group). (c) Relative expression of CD95, CD95L and Bcl2 in livers 0 h (before ConA administration) and 2 h after ConA administration (n = 6–8 mice per group). (d) CD95 and cleaved caspase-3 levels in the liver 8 h after ConA administration (n = 6 mice per group). (e) Mice were injected with anti-CD95 (Jo2) at a dose of 0.2 µg g−1. Blood was harvested 12 h later for ALT level measurement (n = 7 mice per group). H&E staining (f) and TUNEL assay (g) of liver tissues, and cleaved caspase-3 expression (h) in liver sections 8 h after Jo2 administration are shown (n = 6 mice per group). Statistical analyses: Student’s unpaired t test. *P < .05, **P < .01. ns, not significant. Scale bars, 100 μm (a), 50 μm (b), 100 μm (f), 100 μm (g).
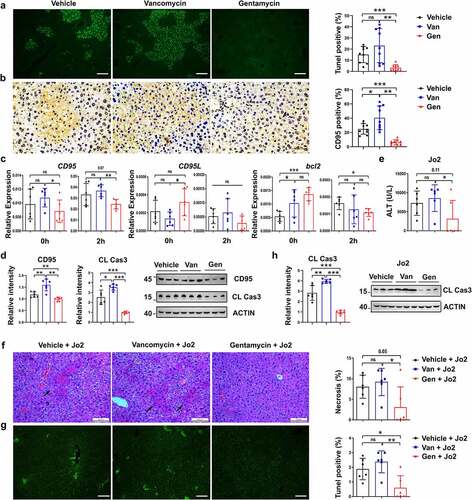
Figure 6. B. acidifaciens reconstitution resulted in lower sensitivity to ConA- and Jo2- induced liver injury in Abx-pretreated mice. (a, b) Experimental strategy. (c) Serum ALT levels were measured 12 h after ConA injection. H&E (d), TUNEL (e) and CD95 IHC staining (f) of liver sections of Abx-pretreated mice reconstituted with a single bacterial strain and treated with ConA (12 h) (n = 6–8 mice per group). (g) CD95 and cleaved caspase-3 expression levels of Abx-pretreated mice reconstituted with a single bacterial strain (isolated from mice) 8 h after ConA injection (n = 6–8 mice per group). (h) Serum IFN-γ, and TNF-α levels were measured 12 h after ConA injection. Serum ALT levels (i) H&E staining and TUNEL assay (j) of BA- and PD-transferred Abx-pretreated mice 12 h after the administration of 0.2 µg g−1 anti-CD95 (Jo2) (n = 8 mice per group). (k) Cleaved caspase-3 expression levels in the liver measured 8 h after Jo2 administration are shown (n = 6 mice per group). The data from three independent experiments were combined. Statistical analyses: Student’s unpaired t test. *P < .05, ***P < .001. ns, not significant. Scale bars, 50 μm (d), 200 μm (e), 50 μm (f), 100 μm (j).
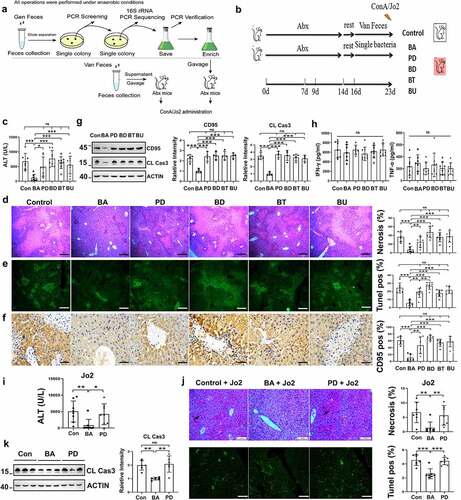
Figure 7. B. acidifaciens reconstitution resulted in lower sensitivity to alcohol-induced liver injury. Serum ALT (a) and TNF-α levels (c) were measured 12 h after alcohol treatment (6 g kg−1) (n = 8 mice per group). (b) Gross liver appearance at 12 h. Representative H&E (d), Oil red O (e) and CD95 IHC staining (f) of liver sections from mice 12 h after alcohol treatment (n = 6–8 mice per group). (g) CD95 and cleaved caspase-3 expression in the liver 8 h after alcohol administration (n = 6 mice per group). Scale bars, 100 μm (d, e). 50 μm (f). *P < .05, ***P < .001. ns, not significant (t test).
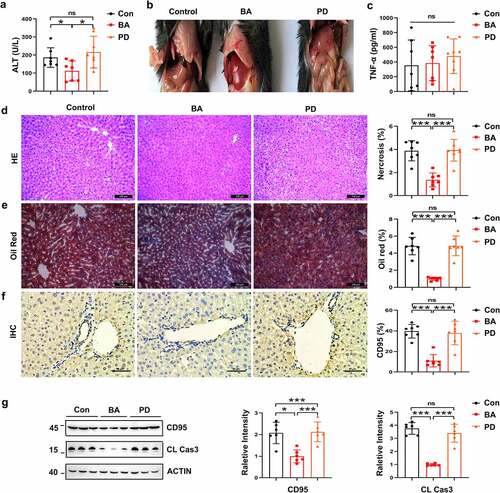
Figure 8. GSH suppressed CD95 expression and ConA-induced liver damage. Liver GSSG/GSH ratio of Van- and Gen-treated mice (a) and BA- and PD-transferred Abx-pretreated mice (b) (n = 7–8 mice per group). Liver GSH levels of Van- or Gen-treated mice (c) and BA- and PD-transferred Abx-pretreated mice (d) 12 h after ConA-injection (n = 6–8 mice per group). (e) The relationship between serum ALT levels and liver GSH levels after ConA administration was analyzed (n = 21 mice). (f) Hepa1–6 cells were cocultured with GSH for 24 h, and CD95-positive cells were quantified using FACS (n = 3 independent biological replicates/group). (g) Serum ALT levels assay of GSH-treated mice (40 mg mice−Citation1) 12 h after ConA injection (n = 5 mice per group). (h) H&E, TUNEL assay and IHC staining of CD95 in liver sections are shown. (i. j) CD95 and cleaved caspase-3 expression in the liver 8 h after GSH administration (n = 4 mice per group). Statistical analyses: Student’s unpaired t test. n, Not different from the Control (0 mM), #, P < .001. ***P < .001, *P < .05, **P < .01, ns, not significant.
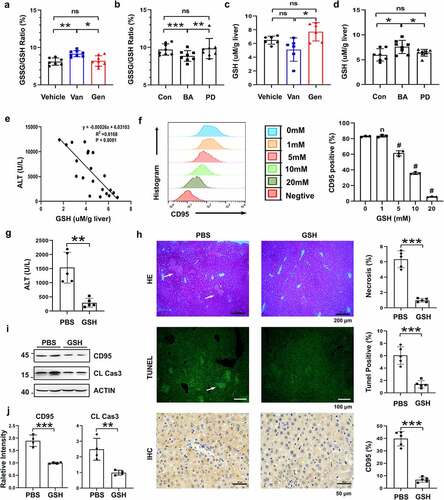
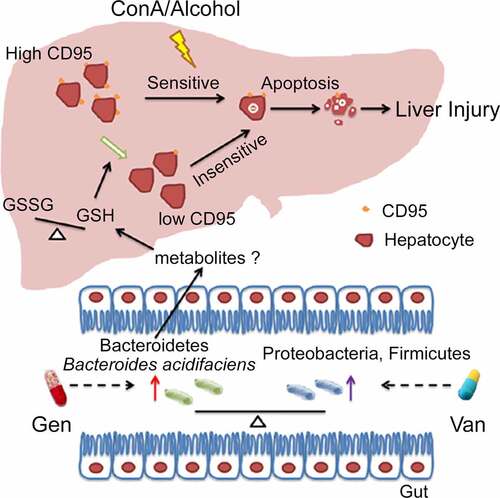
Figure 9. Working model of the mechanism of BA protection against CD95-dependent autoimmune/alcohol-induced liver injury. Antibiotics induce polarization of the gut microbiota. Gen treatment induces the enrichment of BA in the intestine. BA decreases the GSSG/GSH ratio in the liver, likely by secreting some metabolites that inhibit hepatocyte apoptosis and ConA- or alcohol-induced liver injury by suppressing CD95 expression in hepatocytes.