
Figures & data
Table 1. Clinical characteristics at birth, 1 month and 1 year
Figure 1. Flowchart of study inclusion.
Figure 2. Microbiome differences in meconium samples stratified to timing of antibiotic prophylaxis. Relative abundance of the most abundant genera (a) as well as detected indicator species via linear discriminant analysis effect size (P< .05) (b), principal coordinates analysis of beta diversity (permutational multivariate analysis of variance using distance matrices P = .026) (c) and Shannon’s diversity index (pairwise Wilcoxon rank sum test * P = .035) (d) indicated significant impact of intrapartum antibiotic prophylaxis on neonatal microbiome.
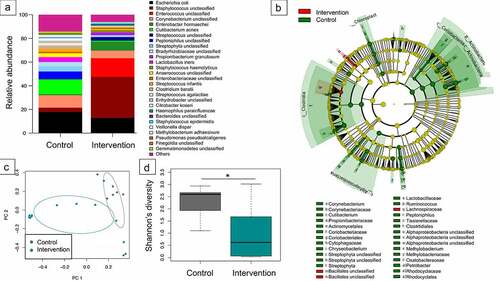
Figure 3. Interdependence of concentration of antibiotics in cord blood with diversity of infant’s gut microbiome in meconium samples. Constrained correspondence analysis with administration of intrapartum antimicrobial prophylaxis set as constrain 1 and concentration of antibiotic in blood as constrain 2 revealed that 6.6% of variation was explained by the concentration of antibiotic in the cord blood suggesting the dependence of changes in microbiome of meconium on the identified concentration of antibiotic.
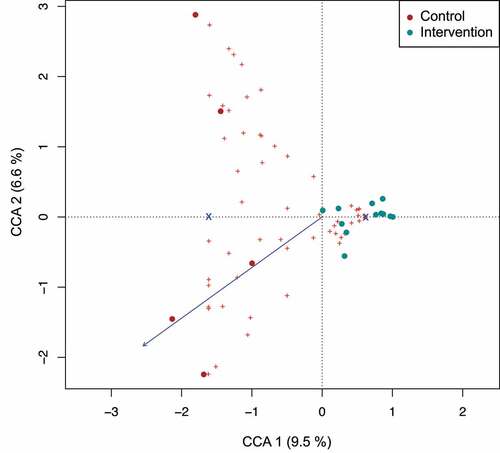
Figure 4. Differential pathway abundance analyses between control- and intervention group stool samples. Heatmap of FDR-adjusted P-values refer to the significance levels obtained by comparing the sum of OTU-counts between samples from the control- and intervention group for OTUs that were predicted to harbor the focal metabolic pathway. Only pathways with an FDR-adjusted P-value < 0.005 in at least one of the age groups are displayed. Dots indicate pathways with P-values below 0.005 (filled circle) and 0.05 (open circles), respectively. Statistical comparison of pathway abundance is based on a zero-inflated beta-binomial (ZIBB) model to account for excessive zeroes and over-dispersion in the sequence count data.Citation37
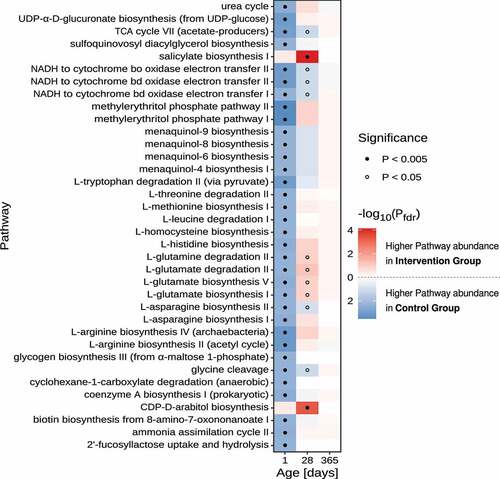
Figure 5. Impact of intrapartum antimicrobial prophylaxis on the gut microbiome at later stages of microbiome development. (a) Indicator species identified via linear discriminant analysis effect size (P < .05) for intervention and control group infants at the age of 1 month. (b) Relative abundance of the genus Clostridium from the family Peptostreptococcaceae (found to be associated with the intervention group at 1 month) is still increased at the time point of 1 year without reaching statistical significance (Wilcoxon rank-sum test).
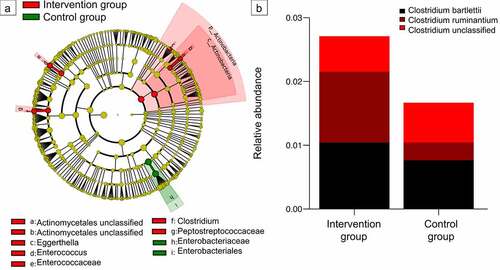
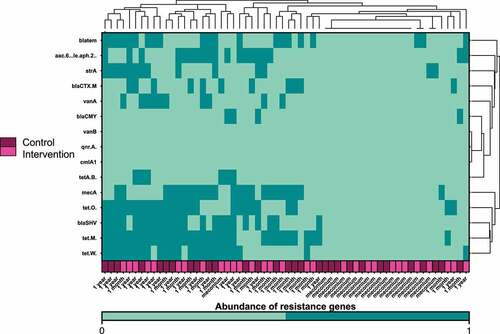
Figure 6. Heatmap and hierarchical clustering according to the abundance of antibiotic resistance genes on the first days of life, at one month and at one year after birth. Timing of antibiotic prophylaxis was selected as covariate for the analysis. Clustering was performed based on the Euclidean distance; dark green represents abundance of the resistance genes and aquamarine the absence.
Supplemental Material
Download MS Word (2.2 MB)Data availability statement
The data that support the findings of this study are openly available in European Nucleotide Archive at https://www.ebi.ac.uk/ena/browser/home, reference number PRJEB47587.