Figures & data
Figure 1. (a) Relative abundance at family level of taxonomy of GIFU and pGIFU microbiota. (b) Metagenome functional prediction by PICRUSt analysis at levels 1, 2 and 3 of KEGG pathways. Histogram bars indicate means of Log2(Level 3 pathway abundance) ± SEM clustered by level 2 (detailed in Supplement A), * p < .05; ** p < .01, *** p < .001, and **** p < .0001. (c) Endotoxin levels of different test media: fresh media GIFU and pGIFU, as well as spent media GIFU-S and pGIFU-S. * p < .05.
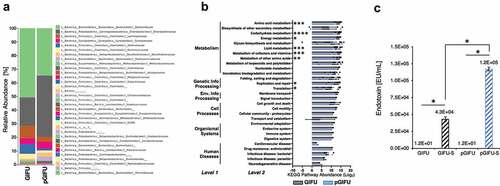
Figure 2. (a) DNA concentration of Caco2/HT29-MTX monolayers with and without dendritic cells (± DC) exposed to different test media. + p < .05 comparing all cultures -DC to +DC (main effect of cell model). (b) Transepithelial electrical resistance (TEER) indicating intestinal barrier function after 24-h exposure of monolayers to test media. * p < .05 comparing spent vs. fresh, ^ p < .05 comparing medium with proinflammatory factors vs. corresponding medium without proinflammatory factors, # p < .05 comparing to control serum-free intestinal cell culture media, with all comparisons within a given cell culture model, and ** p < .05 comparing -DC to +DC exposed to the same medium. All other comparisons are not significant. All measurements were collected from N = 3 biological replicates, and results are reported as an average standard deviation.
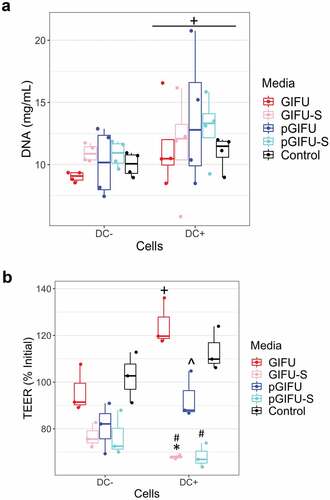
Figure 3. Cocultures with DC stained for tight junction (ZO-1, green) and DNA (DAPI, blue). (←) indicates areas of zig-zag ZO-1 staining pattern and (*) denotes low ZO-1 staining. Scale bar: 20 µm. A similar staining trend was observed for -DC cultures (data not shown).
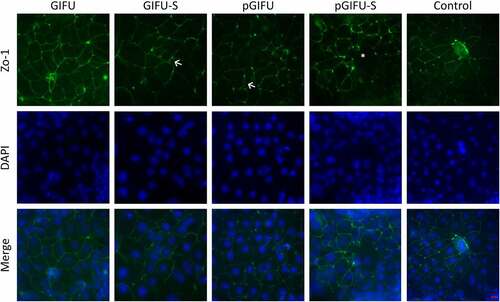
Figure 4. (a) Intracellular and (b) secreted mucin concentration from Caco2/HT29-MTX monolayers with and without dendritic cells (± DC) after exposure to test media. # p < .05 comparing to control serum-free intestinal cell culture media. All measurements were collected from N = 3 biological replicates and results are reported as an average standard deviation.
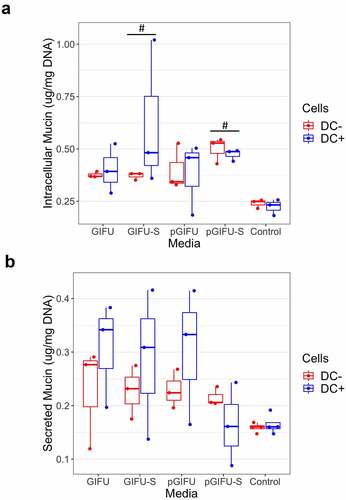
Figure 5. Hierarchical clustering of cytokine z-scores in different experimental groups. The cytokine levels are normalized to DNA concentration, mean-centered, and divided by standard deviation to generate z scores. Color bar indicates the relative cytokine amount, where red and blue correspond to high and low concentrations, respectively.
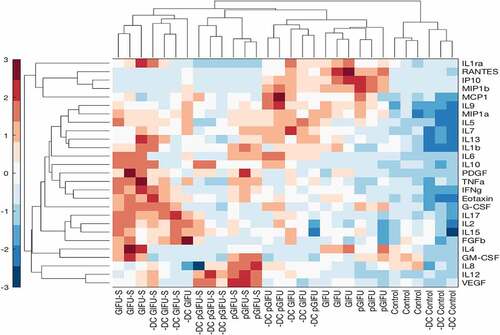
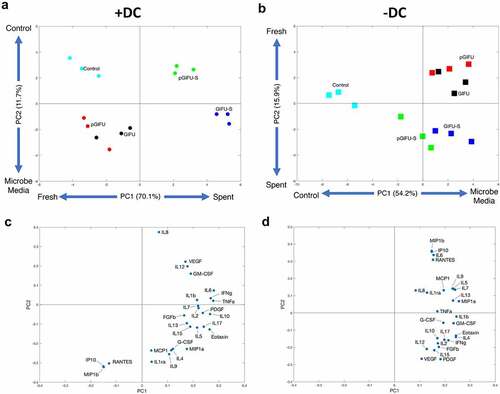
Figure 6. (a, b) Scores and (c, d) Loadings plots for a two-component PCA model constructed using measured cytokines in cultures (a, c) +DC and (b, d) – DC. The percentages noted reflect the percentage of variance in the data set captured in the latent variable.