
Figures & data
Figure 1. The schematic diagram of an engineered EcN strain for hyperuricemia therapy.EcN was engineered to degrade UA via the pathway in Bacillus subtilis. The ygfU gene was co-expressed to facilitate UA transport, VHb was used to improve oxygen utilization, and H2O2, a byproduct of UOX, was eliminated by KatG. The new method to induce hyperuricemia in mice was established by intravenously injecting high concentrated UA. The recombinant strain was used to treat the hyperuricemia mice by oral administration or intravenous injection. Both therapies decreased UA levels of the mice.
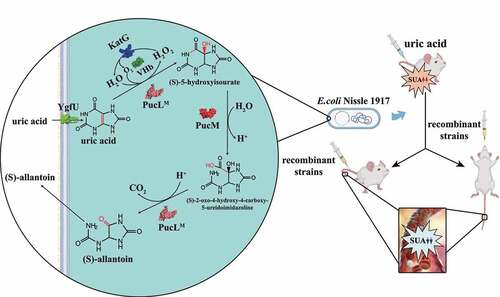
Figure 2. The optimization of UA degradation by engineering EcN cells. (a-b). UA degradation by using crude enzymes (a) or whole cells (b) of engineered EcN expressing PucLT in different plasmids under the control of different promoters. (c) UA degradation by EcN whole cells with PucL, PucLT, and PucLM. (d) UA degradation by EcN whole cells by co-expressing ygfU. The degradation curves were determined in HEPES buffer (pH = 7.0) at OD600 = 1.0 for whole cells or with proteins at 0.8 mg/mL for enzymatic assays. The UA degradation ability of these whole cells or crude enzyme were assayed at defined time intervals. Three parallel experiments were executed to obtain averages and calculate STDEV. The one-way ANOVA method was used to calculate the p value. The Q values were calculated to get the false discovery rate (FDR). Q < 0.05, ‘*’ was marked, Q < 0.01, ‘**’ was marked, Q < 0.001, ‘***’ was marked. In four panels, only the Q value between the mean data of two groups representing the fastest UA degradation rates were shown.
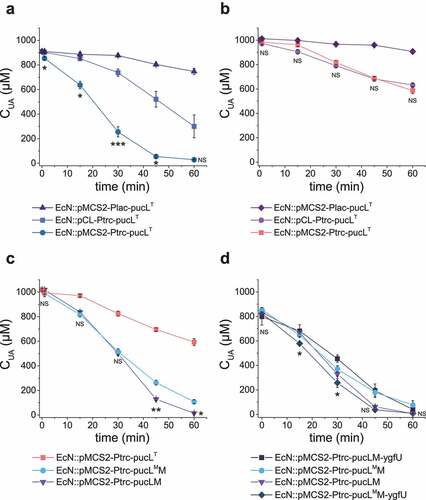
Table 1. Kinetic characteristics of crude enzymes in cell extracts of EcN expressing PucLT, PucLM, and PucLMM
Figure 3. Vhb and KatG facilitated the recombinant EcN strain for UA degradation under either normal oxygen or hypoxic conditions. (a) UA degradation by EcN strains under normal oxygen condition. UA degradation under normal oxygen condition was done in flasks with shaking. The ROS level (b) and DO level (c) were also detected. Three parallel experiments were executed to obtain averages and STDEV. (d) UA degradation by EcN strains under hypoxic conditions, where the DO is 15% of the normal oxygen content in medium. UA degradation under hypoxic conditions was done in a bioreactor with controlled DO. The strains were cultured, induced and resuspended into HEPES buffer (50 mM, pH = 7.0) at OD600 = 1.0. UA degradation by whole cells were assayed. For the bioreactor experiment, error bars were calculated from the data got in three different batches. The student’s t-test method was used to calculate the p value for UA degradation curve. p < .05, ‘*’ was marked; p < .01, ‘**’ was marked, p < .001, ‘***’ was marked, p < .0001, ‘****’ was marked.
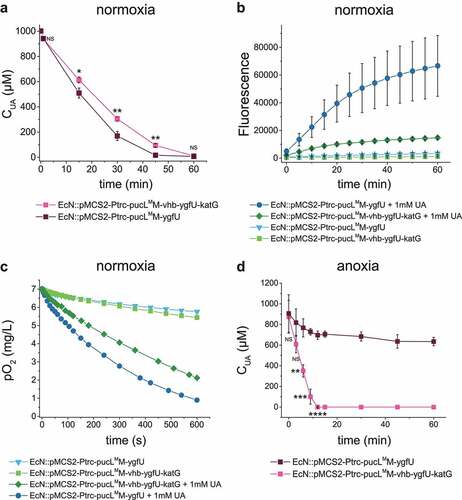
Figure 4. The recombinant EcN strain degraded UA in mouse jejunum. In test group, the optimized engineered EcN strain was oral administered into mice first (n = 6). After 1 hour, the UA was orally administered into these mice. In the positive control group, only UA was orally administered. In the negative control group, neither UA nor EcN was administered. After another hour, the UA levels in stomach (a), duodenum (b) and jejunum (c) were measured. Six parallel experiments were executed to obtain averages and calculate the STDEV. The one-way ANOVA method was used to calculate the p value.The Q values were calculated to get the FDR. Q > 0.05, ‘NS’ was marked; Q < 0.0001, ‘****’ was marked.
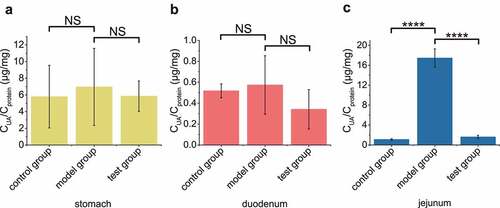
Figure 5. Therapeutic effect by using the engineered EcN strains via oral administration in the UA-injection hyperuricemia mice. (a) The serum UA concentrations in mice after the intravenous injection of UA. It is named as the UA-injection group. (b-d) 2 × 10¹⁰ CFU of the indicated engineered EcN strains containing the UA degrading genes with or without vhb and katG were orally administered once a day for 5 days in mice. Then UA was intravenously injected 1 hour after the last time of intragastric administration of the EcN strains. The serum UA concentrations were determined (b-c). The serum concentrations of H2O2 were determined (d). Six parallel experiments were executed to obtain averages and calculate STDEV. In panel b, the one-way ANOVA method was used to calculate the p value. The Q values were calculated to get the FDR. Q > 0.05, ‘ns’ was marked; Q < 0.0001, ‘****’ was marked. Only the Q values between the mean data of the two groups representing the fastest UA degradation rates were showed. In panel c&d, the student’s t-test method was used to calculate the p value. p > .05, ‘ns’ was marked; p < .05, ‘*’ was marked; p < .01, ‘**’ was marked; p < .001, ‘***’ was marked.
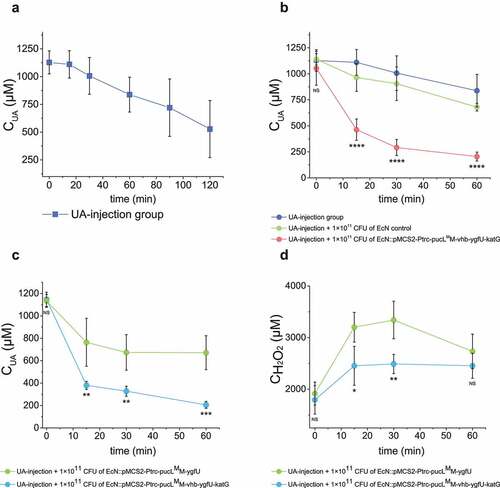
Figure 6. UA degradation by the engineered EcN strain in buffer, serum and mice blood samples. (a) UA degradation by the EcN cells in HEPES buffer (50 mM, pH = 7.0). (b) UA degradation by the EcN cells in mice serum. (c) The degradation ability of engineered EcN strain in the mixed blood of young mice (ages at 6 weeks old, mixed blood samples = 6), (d) The degradation ability of engineered EcN strain in the mixed blood of old mice (ages at 12 weeks old, mixed blood samples = 6). The indicated EcN strain was added to degrade UA in the sample, and then UA was added in several rounds. Three parallel experiments were executed to obtain averages and to calculate STDEV.
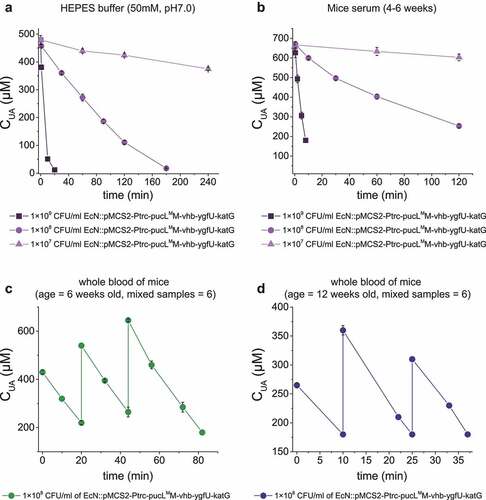
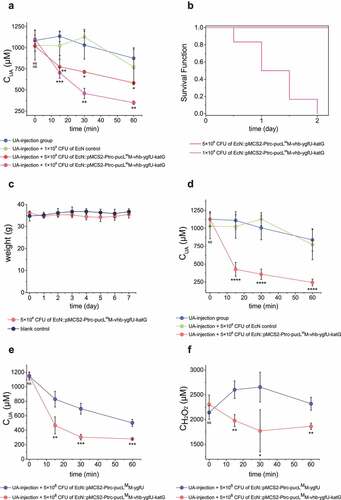
Figure 7. Therapeutic effect by using the engineered EcN strains via intravenous administration in UA-injection hyperuricemia mice. The indicated amount of engineered EcN strains were injected. Then, the UA-injection method was used to induce hyperuricemia in mice. The serum UA levels in different groups were detected at defined time intervals (a, d&e). The serum concentrations of H2O2 were also determined (f). The time intervals between engineered strain injection and UA injection were either 0 hour (a, e&f) or 10 hours (d). (b) The survival curves of mice in the two groups that were injected with two different amounts of engineered EcN strains were given. (c) Body weight of the mice in the two groups that were either injected with 5 × 10⁸ CFU engineered EcN strain or the same volume of saline (control). Six parallel experiments were executed to obtain averages and calculate the STDEV. For data in panel a&b, the one-way ANOVA method was used to calculate the p value. The Q values were calculated to get the FDR. Q < 0.05, ‘*’ was marked; Q < 0.01, ‘**’ was marked; Q < 0.001, ‘***’ was marked; Q < 0.0001, ‘****’ was marked. The Q values represent the comparison between the mean of the indicated group with that of the UA-injection group. For data in panel c&d, the student’s t-test method was used to calculate the p value. p > .05, ‘ns’ was marked; p < .05, ‘*’ was marked; p < .01, ‘**’ was marked; p < .001, ‘***’ was marked.
Supplemental Material
Download Zip (862 KB)Data availability statement
The authors confirm that the data supporting the findings of this study are available within the article and its supplementary materials.