Figures & data
Table 1. Clinical characteristics of all study subjects stratified by carbohydrate intake and the NAFLD activity score.
Figure 1. Stratification of the study population into high carbohydrate (HC) and low carbohydrate (LC) intake groups by carbohydrate intake and associations between nutrient intake and clinical markers in these groups. (a) Percentage of energy intake from carbohydrates, fats, and proteins in the HC and LC groups. (b) Absolute amounts of nutrient intake (in kcals) in each group, stratified by carbohydrate intake (%) and the NAFLD activity score (NAS). (c) The proportion of participants classified as obese population in each group (non-obese, BMI <25; obese, BMI ≥25 kg/m2), stratified by carbohydrate intake (%) and NAS. (d) Linear regression models (with 95% confidence interval bands highlighted in gray) between the levels of alanine transaminase (ALT) and carbohydrate intake (in kcals) with and without adjustment for BMI, age, and sex (HC, upper panel, red line; LC, lower panel, blue line). (e) Heatmap displaying the significant correlations between clinical markers and the intake of nutrients (*P < .05, **P < .01, ***P < .001). Positive correlations are expressed in red and negative correlations are in blue (HC, upper panel; LC, lower panel). (f) Linear regression models (with 95% confidence interval bands highlighted in gray) between clinical markers and the intake of carbohydrates (in kcals) after adjusting for BMI, age, and sex (HC, upper panel, red line; LC, lower panel, blue line).
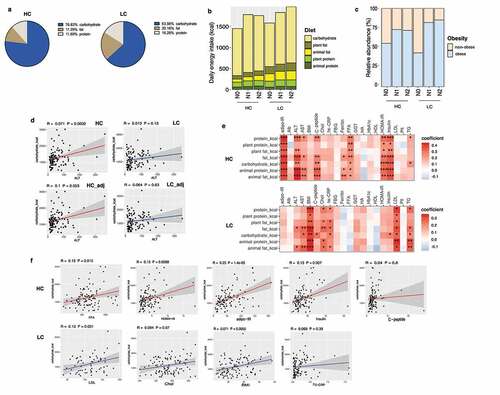
Figure 2. Alterations in the diversity and composition of the gut microbiome according to NAFLD severity in the high carbohydrate (HC) and low carbohydrate (LC) intake groups. (a) Non-metric multidimensional scaling (NMDS) plot based on the Bray-Curtis distance showing the beta diversity of the gut microbiome composition at the genus level (HC: N0, yellow; N1, Orange; N2, red and LC: N0, light sky blue; N1, dark blue; N2, navy). (b) NMDS plot from (A) visualized as Tukey’s box and whisker plot, showing the median and upper and lower quantiles. The nonparametric Kruskal-Wallis test and Dunn’s multiple comparisons test were used for statistical analysis. (c) Alpha diversity in each group (upper left, Simpson’s diversity index; upper right, Pielou’s evenness index; lower left, Shannon diversity index; lower right, species richness). (d) Relative abundances of the top 10 family taxa in the total, HC, and LC groups stratified by the NAFLD activity score.
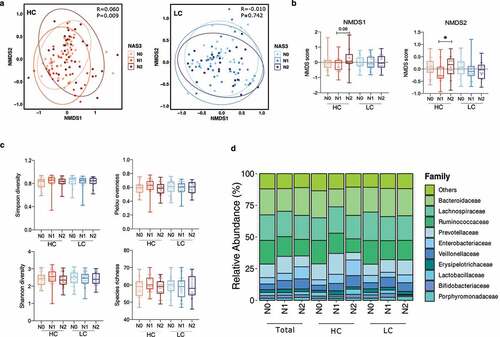
Figure 3. Changes in the relative abundance of the gut microbial taxa according to NAFLD severity in the high carbohydrate (HC) and low carbohydrate (LC) intake groups. (a) The abundance of three representative family taxa and (b) three representative genus taxa are depicted. Nonparametric Kruskal-Wallis tests and Dunn’s multiple comparisons tests were used in the statistical analysis. (c) Ranking of the family taxa according to the mean decrease in the Gini coefficient in the random forest model to predict the NAFLD activity score. (red circle, top 3 families defined by the random forest model; blue pentagon, three representative family taxa) (d–f) Regression analysis was used to determine the abundance of the Ruminococcaceae, Enterobacteriaceae, and Veillonellaceae families after adjusting for confounding factors including BMI, age, and sex. Multivariate association analysis was performed using MaAsLin2 with adjustment for multiple comparisons. (d) Total: P = .0001, q = 0.034; P = .001, q = 0.140; P = .011, q = 0.419. (e) HC: P = .002, q = 0.035; P = .005, q = 0.202; P = .014, q = 0.341. (f) LC: P = .102, q = 0.71; P = .264, q = 0.84; P = .149, q = 0.026. (*P < .05, **P < .01, ***P < .001, †FDR<0.25).
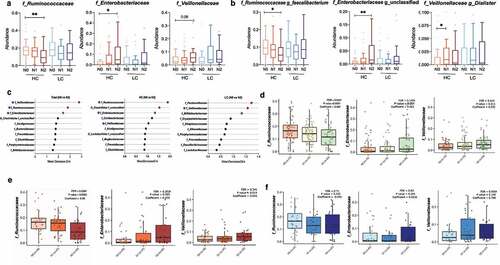
Figure 4. Alterations in the diversity and composition of the gut microbiome according to nonalcoholic fatty liver disease (NAFLD) risk in high carbohydrate (HC) and low carbohydrate (LC) intake groups from the Health Twin cohort. A hepatic steatosis index (HSI) of 30 IU/L was used as the cutoff for determining NAFLD risk in the HC and LC groups (HC, n = 382; LC, n = 300). (a) NMDS plot showing the beta diversity of the gut microbiome composition in subjects with and without liver injury. NMDS scores were calculated using Bray-Curtis distance (HC group: HSI <30, pink; HSI ≥30, purple; LC group: HSI <30, yellow-green; HSI ≥30, dark green). (b) Alpha diversity was calculated using four indices (upper left, Simpson’s diversity index; upper right, the Shannon diversity; lower left, Pielou’s evenness index; lower right, species richness). (c) Relative abundances of the top 10 families are visualized in stacked bar plots for all patients as well as the HC and LC groups, stratified by liver injury severity. (d) Univariate analysis of three key microbial families using nonparametric Mann-Whitney tests and Dunn’s multiple comparisons tests (*P < .05, **P < .01, ***P < .001).
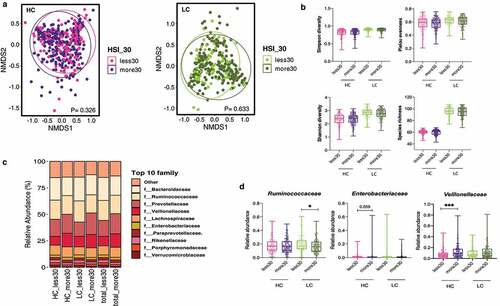
Figure 5. Changes in de novo lipogenesis (DNL)-related transcripts in the high carbohydrate (HC) intake group. (a) Heatmap displaying the correlation between DNL-related genes and the NAFLD activity score (NAS) in the HC and LC groups. Statistical analysis was performed using transformed z scores and Spearman’s rank correlation analysis. (b) Z score-transformed expression levels of predefined transcripts were compared between the HC and LC groups according to NAFLD severity using an one-way analyses of variance and the FDR correction for multiple comparisons. (c) Differentially expressed genes were defined using the R package DEseq2. The upper panel indicates log10 transformed P values and the lower panel indicates log2 transformed fold changes. (d) The linear regression model depicts the relationship between SREBF2 and Enterobacteriaceae after adjustment for BMI, age, and sex (*P < .05, **P < .01, ***P < .001).
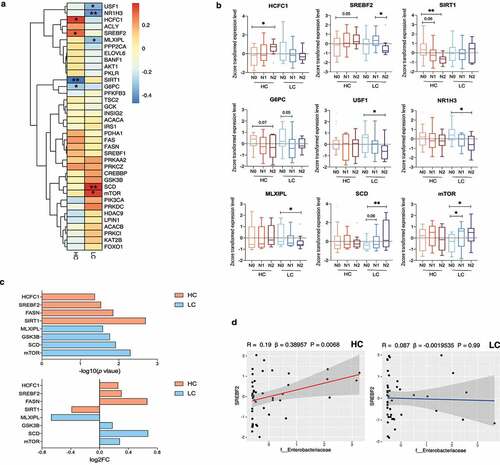
Figure 6. Noninvasive multidimensional prediction of nonalcoholic steatohepatitis (NASH) using three microbial families and potential clinical variables in all subjects as well as the high carbohydrate (HC), and low carbohydrate (LC) intake groups (non-NASH vs. NASH). The receiver-operating characteristic (ROC) curve was designed for detecting NASH among study subjects with biopsy-proven NAFLD. Area under receiver-operating characteristic curves (AUROC) analyses including clinical variables (BMI, age, and sex) (blue) vs. those also including the three microbial families (Enterobacteriaceae, Ruminococcaceae, and Veillonellaceae) in addition to clinical variables (BMI, age, and sex) (red) plotted for the diagnosis of NASH in (a)all subjects as well as, (b) the HC, and (c) LC groups. P values were calculated using the DeLong test.

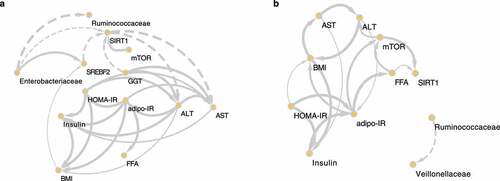
Figure 7. The causal relationships among nonalcoholic steatohepatitis (NASH)-related microbes, transcripts, and clinical factors in the high carbohydrate (HC) and low carbohydrate (LC) intake groups. Causal inference of inverse, normally transformed microbiome families (Ruminococcaceae and Enterobacteriaceae), transcripts (SREBF2, SIRT1, and mTOR), and clinical variables (ALT, AST, adipo-IR, HOMA-IR, insulin, FFA, and BMI) were calculated using kernel causality analysis; significant causal correlations were visualized using Cytoscape. Causality of variables in the (a) HC and (b) LC groups. Solid line indicates a positive correlation and the dashed lines indicates a negative correlation. The thickness of the line indicates the degree of statistical significance (thin: less significant P values; thick: more-significant P values).