
Figures & data
Figure 1. Phospholipid cleavage by C. jejuni PldA. LC-MS spectra of (a) the main LPLs in wildtype C. jejuni strain 81116. (b) lysoPG (19:0c) in C. jejuni wildtype and C. jejuni ΔpldA.
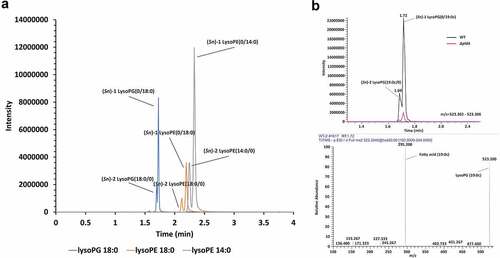
Figure 2. C. jejuni lysoPE induced hemolysis. (a) C. jejuni strains were incubated with erythrocytes from different species; the hemolysis results depicted in the left panel were quantified by measuring absorbance at 420 nm. (b-e) Hemolysis of horse erythrocytes after incubation with: (b) live, heat-treated or sonicated C. jejuni, or with the cell-free supernatant of C. jejuni; (c) live bacteria, whole membrane or protease K-treated membranes of C. jejuni; (d) purified major phospholipid classes; (e) commercially available LPLs. MilliQ water and DPBS were used as positive (100% value) and negative (0% value) control in the hemolysis assay, respectively. Data of three independent experiments with three independent preparations of bacterial samples are presented as mean values ± standard deviation, *P < .1, **P < .01, ***P < .001, ****P < .0001, ns P > .1.
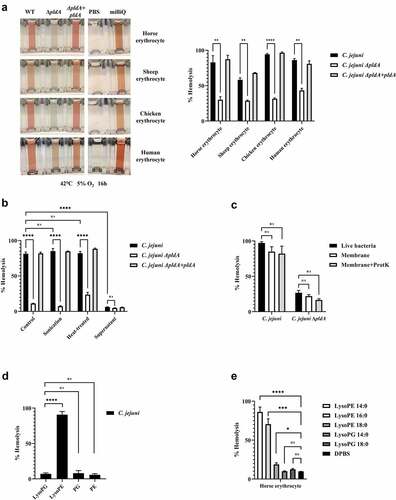
Figure 3. C. jejuni lysoPE-induced toxicity for host cells rescued by vitamin E and DPPD. (a) LDH release of HeLa and Caco-2 cells treated with C. jejuni strains . (b) HeLa cells treated with purified phospholipid fractions. (c) HeLa cells treated with commercially available LPLs. (d-e) Horse erythrocytes and (f- g) HeLa cells were treated without or with vitamin E or DPPD, washed and then exposed to lysoPE 14:0. Data are from three independent experiments with three independent preparations of bacterial samples and presented as mean values ± standard deviation, *P < .1, **P < .01, ***P < .001, ****P < .0001, ns P > .1.
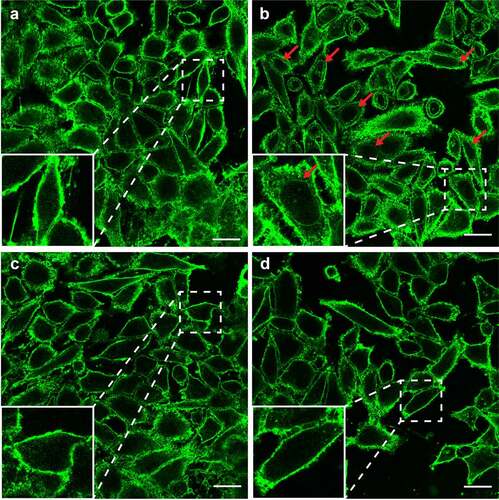
Figure 4. LysoPE permeabilizes the epithelial cells membrane. HeLa cells incubated with (a) DPBS, (b) lysoPE 14:0, (c) lysoPG 14:0, or (d) pre-treated with vitamin E, washed and incubated with lysoPE 14:0 were stained with the membrane stain fluorescent WGA (green) and/or nuclear DAPI stain (blue) and visualized by confocal microscopy. Red arrows point to nuclear membrane stained with WGA. White scale bars represent 5 μm.
Supplemental Material
Download Zip (17.8 MB)Data availability statement
The authors confirm that the data supporting the findings of this study are available within the article and its supplementary materials.