Figures & data
Figure 1. Enterotype analysis in CDI and IBD patients reveals consistency between the two diseases. (a) Outline of cohort collection for FMT to treat CDI and IBD. Only studies that provide detailed metadata about FMT outcomes are depicted. Each column represents one analyzed cohort, denoted by the study’s first author’s abbreviated name. “Discov.” and “Val.” indicate our recruited cohorts for discovery and validation, respectively. “#” and dot size represent the number of sample size in each cohort, blue dots represent samples from recipients after FMT. (b) Bray-Curtis beta-diversity ordination of samples from CDI and IBD patients (n = 322 stool samples). RCPT/E (dark red) and RCPT/B (Orange) are the two enterotypes clustered by enterotype tutorial. (c) Distribution of unchanged and variable individuals among three approaches of enterotype clustering (partitioning around medoids (PAM) separate, PAM combined and Dirichlet multinomial mixtures (DMM) combined). “Unchanged” means that the individual gets the same enterotype with two approaches, and “variable” vice versa. (d) Relative abundance distribution of two enterotype dominant bacteria (RCPT/E and RCPT/B). Enterobacteriaceae represents the dominant genus in RCPT/E. (e) The number of enterotype-associated genera in different approaches (Wilcoxon test, q < 0.0001). “CDI” means including only individuals with CDI to obtain enterotype-associated genera, “IBD” means including only IBD, and “CDI & IBD” means both diseases. (f) Alpha diversity between two enterotypes in CDI and IBD. The boxplot center represents median, and the box shows the interquartile range (IQR). Whiskers extend to the most extreme data point < 1.5 x IQR. Asterisks indicate significance (****p < .0001, ***p < .001). (g) Differential abundance of 14 enterotype-characteristic taxa in two enterotypes (Wilcoxon test, q < 0.0001). Differential abundance was calculated by subtracting the mean relative abundance between two enterotypes for each enterotype-characteristic taxon. Family name represents the genus for f__Family name; g__. The enterotype-characteristic taxa are sorted according q value. All q value represents the p value adjusted by the Benjamini-Hochberg false discovery rate.
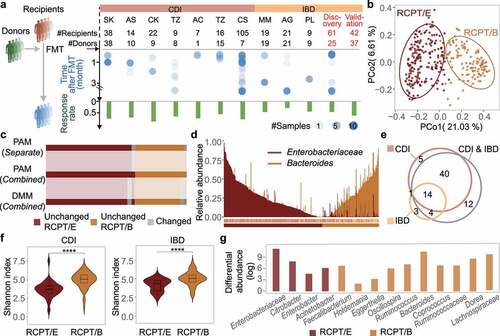
Figure 2. FMT outcome was significantly associated with the microbiota distance between recipient and donor. (a) Comparisons of alpha diversity in individuals with two enterotypes and donors across time in FMT (n = 322). (b) Relative abundance variation of the dominant genus during FMT. Enterobacteriaceae represents the dominant genus in RCPT/E. (c) Distribution of recipients in different FMT outcome groups (response and failure) (n = 286). The two coordinates represent the BC distance between the recipient after FMT and the same recipient before FMT or their donor before FMT, respectively. The green and gray points represent the response and failure of FMT, respectively. ANOSIM was performed for the two groups (response and failure) (ANOSIM test, statistic = 0.11, p = .001). (d-f) Analyses were reproduced in CDI recipients (d), IBD subtype CD recipients (e) and IBD subtype UC recipients (f). Left: Community variability was determined by the Bray-Curtis (BC) distance over time during FMT. The red and blue dots represent the BC distance between the recipient and its donor before and after FMT. The two lines fit the trends of RCPT/E and RCPT/B, respectively. Middle: Distribution of recipients in different FMT outcome groups. Right: the cumulative abundance of significantly response-enriched or response-depleted taxa in donors and patients before FMT (Wilcoxon test, q < 0.05). The q value represents the p value adjusted by the Benjamini-Hochberg false discovery rate. Cumulative abundance was calculated by summing all genera that were significantly enriched or depleted in the response group. Asterisks indicate significance (****p < .0001, ***p < .001, **p < .01, *p < .05).
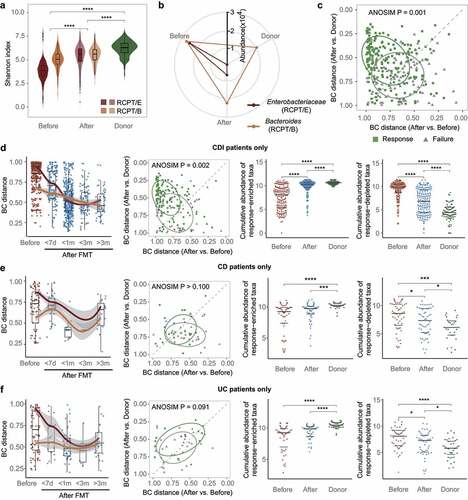
Figure 3. Bacterial engraftment in recipients. (a) Schematic of how to estimate the ratio of colonizers to residents after FMT (C2R). Gut bacteria in recipients after FMT were classified into colonizers and residents based on distance to donors and themselves before FMT. The C2R was calculated by the ratio of summed abundance between colonizers and residents in log-space. (b) Mean relative abundance during FMT of Faecalibacterium, Fusobacterium in all patients, Prevotella in IBD patients, and Clostridioides in CDI patients. The error bar indicates the 95% confidence interval. (c) C2R in the response and failure groups (n = 286, Wilcoxon test, p = .0045). The density of the number of recipients was depicted in the y-axis. (d) C2R and similar equations obtained by source tracking (Spearman correlation, r = 0.78).
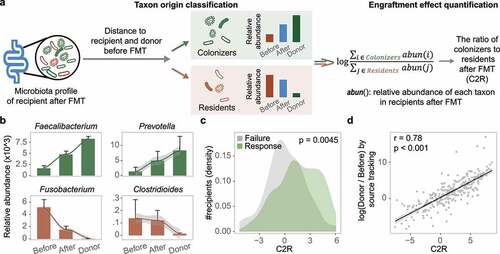
Figure 4. Enterotype-based donor-recipient matching contributes to FMT success. (a) FMT efficacy for different enterotypes of recipients and donors (n = 286). The statistic represents the number of patients who received FMT. (b-c) C2R (b) and Bray-Curtis (BC) distance (c) between the response and failure groups of RCPT/E after FMT (n = 182). The density of the number of recipients was depicted in the y-axis (b). (d) BC distance between RCPT/B patients and donors of DONOR/P or DONOR/B (n = 104). (e) The summed alpha diversity between the response group and the failure group of RCPT/B (n = 104). The summed alpha diversity was calculated by summing the Shannon alpha diversity of paired recipients and donors. (f) The cumulative abundance curve of donor-specific genera in recipients or donors during FMT. Donor-specific genera were those with significant differences in abundance between DONOR/P and DONOR/B (Wilcoxon test, q < 0.05). Cumulative abundance was calculated by summing corresponding donor-specific genera in recipients before or after FMT. To make this measure comparable between the two donor enterotypes, the cumulative abundance was normalized to the level of corresponding donors separately (DONOR/P or DONOR/B). The sample fraction was normalized by the number of recipients in each group (transplanted by DONOR/P or DONOR/B). (g) Enterotype transition in recipients treated with different donors (DONOR/P and DONOR/B). Blue and yellow lines represent DONOR/P and DONOR/B, respectively. The number represents the fraction of enterotype transitions, and only fractions higher than 0.25 are depicted. (h) The response rate of recipients with enterotype transition. DONOR/P and B represent the enterotypes of the donor for the recipients. Asterisks indicate significance (****p < .0001, ***p < .001, **p < .01, *p < .05).
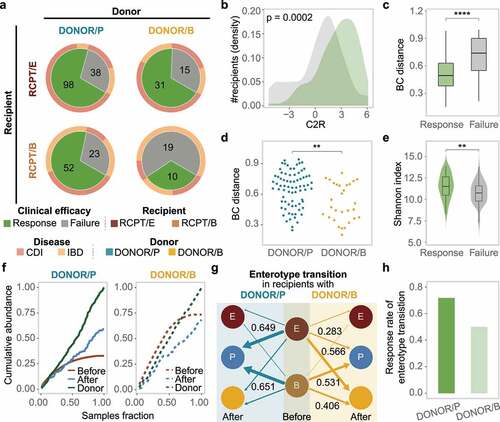
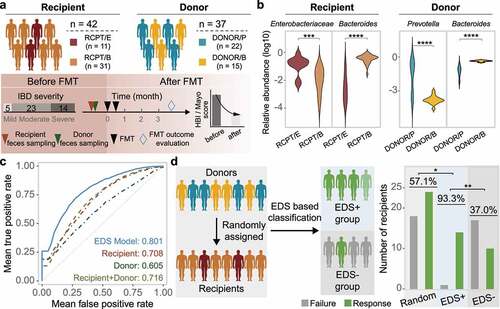
Figure 5. Construction and validation of the enterotype-based donor selection model. (a) Outline of the validation cohort (n = 42). Characteristics of recipient and donor are depicted in the upper and bottom panel. Response rate was determined based on a at least 3-month follow-up for each recipient. (b) Dominant taxa of recipients and donors from different enterotype in the validation cohort. Enterotype of each individual was assigned by the medoids of the known enterotypes. Enterobacteriaceae represents the dominant genus in RCPT/E. (c) Receiver-operating characteristic (ROC) curves for the enterotype-based donor selection (EDS) model and other alternative models by 5-fold cross-validation with 500 iterations in CDI and IBD (n = 286). (d) The performance of the EDS model in the validation cohort (n = 42). The left panel depicts the schema of donor assignment (the random group) and by the EDS model (the EDS group). The right panel depicts the distribution of FMT outcomes (response and failure) in the random group and the EDS group. Asterisks indicate significance (****p < .0001, ***p < .001, **p < .01, *p < .05).