
Figures & data
Figure 1. RecA levels in E. coli O157:H7 incubated with apyrase 10 and 20 U/mL. a) Immunoblot showing RecA in E. coli O157:H7 lysate incubated with apyrase for 6 h. b) Intensity of RecA bands in relation to dH2O control defined as 100%. Data are presented as the median and individual values from two independent experiments, **P < 0.01, Kruskal-Wallis multiple-comparison test followed by Dunn’s procedure.
Figure 2. Shiga toxin 2 phage induction in E. coli O157:H7 incubated with apyrase in vitro. The levels of Stx2 phage DNA stx2 were measured by qPCR in E. coli O157:H7 supernatants from bacteria cultured with or without apyrase (10 or 20 U/mL) for 6 h. The stx2 gene was quantified as a marker for the Stx2 phage. Data are presented as the median and individual values from two independent experiments, *P < 0.05, ****P < 0.0001, Kruskal-Wallis multiple-comparison test followed by Dunn’s procedure.
Figure 3. Shiga toxin 2 release from E. coli O157:H7 incubated with apyrase in vitro. E. coli O157:H7 was incubated with 1, 5 or 10 U/mL of apyrase and Stx2 levels measured in culture supernatants. After 6 h incubation there was a dose-dependent and significant decrease in Stx2 release from E. coli O157:H7 compared to untreated bacteria. Stx2 concentration from three separate experiments is presented as percentage of the negative control (dH2O). The bar represents the median. **P < 0.01, ***P < 0.001, Kruskal-Wallis multiple-comparison test followed by Dunn’s procedure.
Figure 4. The effect of apyrase treatment on onset of disease, weight and bacterial colonization in mice infected with E. coli O157:H7 and uninfected. a) Development of clinical signs of disease in E. coli O157:H7 (EHEC)-infected mice treated with phosphate-buffered saline (PBS vehicle, n = 10, blue line), apyrase (n = 11, red line) and uninfected mice treated with PBS (vehicle, n = 4, green line) or apyrase (n = 5, purple line). Infected mice in the untreated group started to develop symptoms from day 3 whereas mice in the apyrase-treated group started to develop symptoms 2 days later. b) Weight changes in mice starting 1 day before inoculation with EHEC until day 11 post-inoculation. A significant difference between infected groups treated with apyrase or PBS was observed on day 2 and 3 (both *P < 0.05) and day 4 **P < 0.01, two-tailed Mann-Whitney U test. c) Colony forming units in feces of EHEC-infected mice, treated with apyrase or untreated, on days 1, 3 and 5 showing no difference in colonization. Data are presented as median and range.
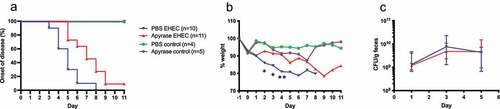
Figure 5. The effect of apyrase on goblet cell depletion in mice infected with E. coli O157:H7. Goblet cells in Periodic acid-Schiff (PAS)-stained colons from mice sacrificed 2 days after inoculation with E. coli O157:H7 before the development of symptoms. a) An E. coli O157:H7-infected and vehicle-treated mouse exhibited few filled goblet cells. b) Colon from a mouse infected with E. coli O157:H7 and treated with apyrase showed an abundance of filled goblet cells (arrow). c) The number of filled goblet cells/villus in E. coli O157:H7-infected mice treated with vehicle (PBS) (n = 12), or apyrase (n = 12) or uninfected controls treated with vehicle (n = 7) or apyrase (n = 8). Filled goblet cells per villus are presented from individual mice, the bar represents the median. **P < 0.01, Kruskal-Wallis multiple-comparison test followed by Dunn’s procedure. Scale bar 50 μm.
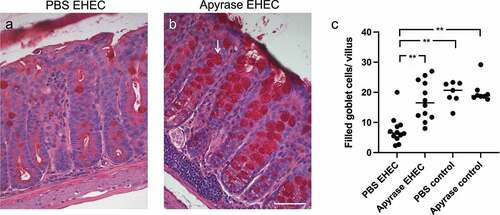
Figure 6. Intestinal apoptosis in mice infected with E. coli O157:H7. TUNEL-positive cells were assessed in mouse colons 2 days after inoculation with E. coli O157:H7 before the development of symptoms. a) Colon from a mouse inoculated with E. coli O157:H7 and treated with vehicle exhibited apoptotic cells (white arrow, green labeling) close to the lumen. b) Colon from an infected mouse treated with apyrase showed minimal TUNEL-positivity. c) Uninfected control mouse treated with vehicle. d) Uninfected control mouse treated with apyrase. e) Number of TUNEL-positive cells/100,000 μm2 in E. coli O157:H7-infected mice treated with vehicle (PBS) (n = 5) or apyrase (n = 4). The bar represents the median. Green: TUNEL positive cells; blue: DAPI: 4',6-diamidino-2-phenylindole. * P < 0.05, two-tailed Mann-Whitney U test. Scale bar 100 μm.
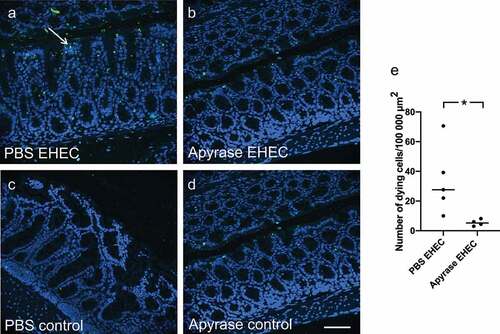
Figure 7. ATP in feces of E. coli O157:H7-infected mice. Levels of ATP in mouse feces were assayed. a) One day after E. coli O157:H7 infection, in PBS-treated (n= 15) or apyrase-treated mice (n= 15), showing significantly lower ATP in the apyrase-treated mice. b) ATP in murine feces three days after EHEC infection in mice treated with PBS (n=10) or apyrase (n=11), showing no difference between the groups. Luminescence units in candela per square meter (cd/m2). Data are presented from individual mice, the bar represents the median. *P<0.05, two-tailed Mann-Whitney U test.
Figure 8. Shiga toxin 2 in fecal samples from E. coli O157:H7-infected mice. Levels of Shiga toxin 2 (Stx2) in murine feces were analyzed. a) Stx2 in feces three days after E. coli O157:H7 inoculation in PBS vehicle-treated (n=10) or apyrase-treated (n=11) mice. Two separate experiments are presented in which unfilled and filled circles represent one experiment each. b) Fold change of Stx2 in feces three days after E. coli O157:H7 infection. The median of PBS vehicle-treated mice was defined as 1. *P<0.05, two-tailed Mann Whitney U test. Data are presented from individual mice, the bar represents the median.
Figure 9. Aggregation in platelet-rich-plasma treated with apyrase and stimulated with Shiga toxin 2 and O157 LPS. Platelet aggregation induced by collagen in platelet-rich-plasma preincubated with Shiga toxin (Stx2) and E. coli O157 lipopolysaccharide (LPS) or left unstimulated (PBS), with or without apyrase. a) The speed of platelet aggregation (slope, see Supplementary Figure 4) in platelet-rich-plasma preincubated with Stx2 and O157 LPS was increased compared to unstimulated collagen-activated platelets. In the presence of apyrase this increase was abrogated. b) Similar differences were observed in maximal platelet aggregation with higher aggregation in samples preincubated with Stx2 and O157 LPS compared to untreated samples. Apyrase abolished this effect. Data are presented from individual experiments, the bar represents the median. n.s: not significant, *P < 0.05, **P < 0.01, ****P < 0.0001. Kruskal-Wallis multiple-comparison test followed by Dunn’s procedure.
Supplemental Material
Download Zip (5.5 MB)Data availability statement
The authors confirm that the data supporting the findings of this study are available within the article and its supplementary materials.