Figures & data
Table 1. The baseline characteristics of ADHD subgroup patients (I-ADHD = 38; C-ADHD = 53) and HCs (n = 109) in the study cohort.
Figure 1. Alpha and beta diversity analyses in all patients with ADHD and HCs. (a) Gene count and alpha diversity (Shannon index) in all patients with ADHD and HCs. The Wilcoxon rank-sum test was used to determine significance. (b) Supervised analysis with sparse PLS-DA in all patients with ADHD at the gene level. PERMANOVA calculation based on the Bray–Curtis distance at the gene level. (c) LDA effect size analysis identified significantly different taxa between the total ADHD cohort and HCs. The LDA scores (log 10) > 2 and p < .05 are shown. A negative LDA score indicated enrichment in patients with ADHD (purple), while a positive LDA score indicated enrichment in HCs (green). Bar length indicates the effect size of each taxon. (d) Taxonomic cladogram obtained from LEfSe analysis. The circles from inside to outside represent different classification levels, and the size of each dot is proportional to its relative abundance. The colored taxa represent significantly different taxa between the total ADHD patient cohort and HCs. Purple, total ADHD-enriched; Green, HC-enriched.
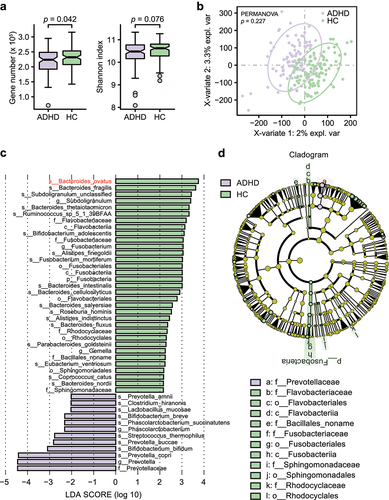
Figure 2. Alpha and beta diversity analyses in subgroups of patients with ADHD and HCs. (a) Gene count and alpha diversity (Shannon index) in patient subgroups and HCs. The Wilcoxon rank-sum test with Benjamini Hochberg adjustment was used to determine significance. (b) Supervised analysis with sparse PLS-DA in patient subgroups at the gene level. PERMANOVA calculation based on the Bray–Curtis distance at the gene level. LDA effect size analysis identified significantly different taxa between I-ADHD and HC (c) and between C-ADHD and HC (e). The LDA score (log 10) > 2 and p < .05 are shown. Bar length indicates the effect size of each species. Taxonomic cladogram obtained from LEfSe analysis for different comparisons (D, I-ADHD vs. HC; F, C-ADHD vs. HC). The circles from inside to outside represent different classification levels, and the size of each dot is proportional to its relative abundance. The colored taxa represent significantly different taxa between the ADHD and HC subgroups. Blue, I-ADHD-enriched; purple, C-ADHD-enriched; Green, HC-enriched.
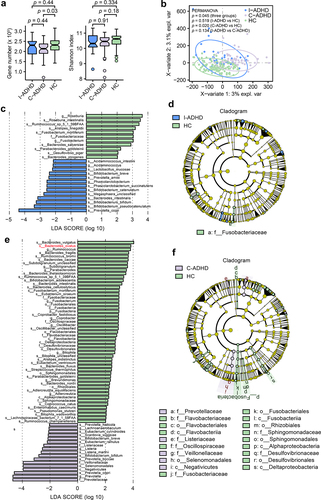
Figure 3. The gut microbial composition of C-ADHD is different from that of I-ADHD and HCs. (a) Venn diagram of significantly different taxa among different comparisons. (b) Heatmap of shared significantly different taxa among different comparisons. LEfSe analysis was used to detect significantly different taxa in (A) and (B). (c) Boxplot of significantly different species among HCs, I-ADHD, and C-ADHD. Significant differences among groups were evaluated using the Jonckheere-Terpstra test and adjusted by the Benjamini–Hochberg (BH) method (p < .05).
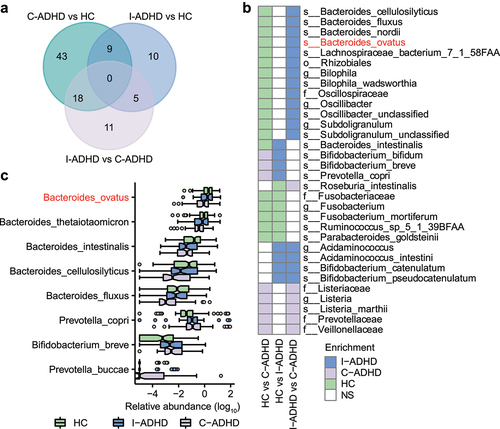
Figure 4. Correlation between gut microbiota species and ADHD clinical characteristics. (a) Heatmap of Spearman’s correlation coefficient between the relative abundance of species and ADHD clinical characteristics (red and purple for positive and negative correlation, respectively). The species enrichment direction in different comparisons is shown on the left. Blue, I-ADHD-enriched; purple, C-ADHD-enriched; green, HC-enriched; gray, no significant difference. ‘+’ denotes p < .01; ‘*’ denotes p < .001. Classification of samples among different groups by relative abundance at the species level (b-d). (b) ROC generated between patients with ADHD and HCs by 6 microbial markers selected by the random forest model. The AUC was 0.84, and the 95% CI was 0.79–0.90 (green area). (c) ROC generated between patients with C-ADHD and HCs by 8 microbial markers selected from the random forest model. The AUC was 0.89, and the 95% CI was 0.84–0.95. (d) ROC generated between patients with I-ADHD and HCs by 35 microbial markers selected by the random forest model. The AUC was 0.76, and the 95% CI was 0.67–0.86.
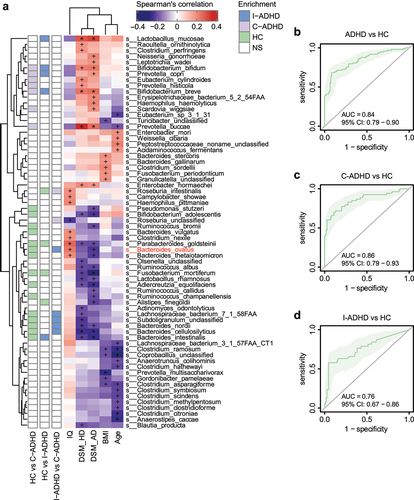
Figure 5. Bacteroides ovatus ATCC8483 gavage ameliorated spatial working memory in SHRs. (a) Schematic diagram of Bacteroides ovatus transplantation and behavioral tests. There were three groups (per group = 7–9 rats): Saline (gavage with saline during the first 24 days as a control), ABX+Saline (treated with an antibiotic cocktail within the first 10 days and saline for the next 14 days via oral gavage and drinking water), and ABX+B. ovatus (treated with an antibiotic cocktail within the first 10 days and Bacteroides ovatus for the next 14 days via oral gavage and drinking water). (b) Spontaneous alternations of each group were recorded in the Y maze. (c) Comparison of the recognition index among different rat groups. (d) For the open field test, the time spent in the center and the total distance of locomotion of each group were analyzed. Mean ± SEM are plotted; one-way ANOVA followed by the Tukey–Kramer post hoc test. ABX: antibiotic cocktail, OFT: open field test, NOR: novel object recognition, MBT: marble burying test, EPM: elevated plus maze.
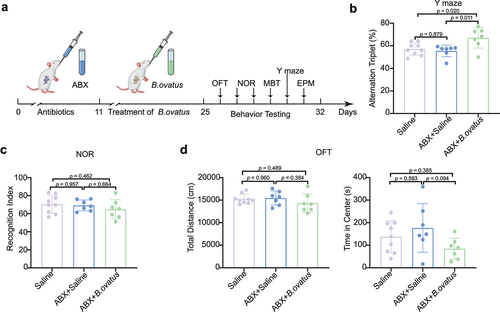
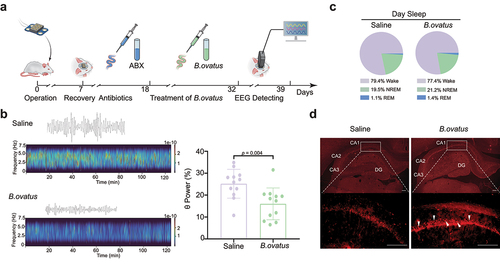
Figure 6. Bacteroides ovatus ATCC8483 administration corrected aberrant θ EEG rhythms and activated hippocampal neurons in SHRs. (a) Schematic diagram of Bacteroides ovatus transplantation and EEG recording. There were two groups (per group = 12 rats): Saline (treated with an antibiotic cocktail within the first 10 days and saline for the next 14 days via oral gavage and drinking water as a control) and B. ovatus (treated with an antibiotic cocktail within the first 10 days and Bacteroides ovatus for the next 14 days via oral gavage and drinking water). (b) Representative wave and spectrogram of θ EEG rhythms in saline and B. ovatus-colonized SHRs and θ rhythm percentage in the total EEG. (c) The proportion of REM sleep, NREM sleep, and wakefulness in saline- and B. ovatus-treated SHRs, recorded by EEG/EMG. (d) cFos+ neurons in the hippocampal CA1, CA2, CA3, and DG subregions of SHRs 90 min after the Y maze test at day 39. Scale bar = 200 μm. Mean ± SEM are plotted; 2-tailed Student’s t test. REM: rapid eye movement, NREM: nonrapid eye movement, DG: dentate gyrus.