
Figures & data
Figure 1. Indole inhibits EPEC T3SS activity in a dose-dependent manner. Wild type (WT) EPEC and escN null-mutant (ΔescN) EPEC were grown under optimal T3SS-inducing conditions aerobically (a-b) and anaerobically (c) for 6 h in the presence of various concentrations of indole. Bacterial supernatants and pellets were separated, normalized, and analyzed via 12% SDS-PAGE with Coomassie staining (a) or western blotting analyses performed using anti-EspB, anti-Tir, and anti-DnaK antibodies (b-c). DnaK levels were used to confirm equal levels of lysate loading in these different samples. In panel A, the T3SS-secreted translocators, EspA, EspB, and EspD, are marked on the right of the gel. The location of EspC, which is not secreted via the T3SS, is also marked.
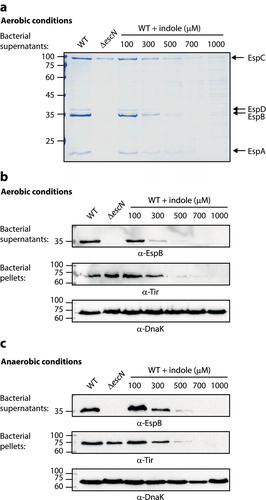
Figure 2. Indole interferes with the crosstalk between EPEC and V. cholerae. (a) Pure overnight cultures of EPEC and V. cholerae strains were sub-cultured in fresh 1:1 (v/v) DMEM: LB as single or mixed cultures. These cultures were grown in the presence or absence of indole under semi-optimal T3SS-inducing conditions for 6 h, and then the bacterial pellets and supernatants (bacterial sup) were separated, normalized, and analyzed. The secreted proteins were concentrated from collected supernatants and analyzed via 12% SDS-PAGE and western blotting using an anti-EspB antibody. The expression of the effector protein Tir, which should remain present primarily within the bacterial cytoplasm at this stage, was analyzed by subjecting the bacterial pellets to SDS-PAGE and western blotting using an anti-Tir antibody. Samples were also probed with anti-DnaK to confirm equal loading. Samples from the cultures were plated on LB plates containing chloramphenicol for EPEC growth. The plates were incubated overnight at 37°C, and bacterial colony-forming units (CFUs) were then counted. CFUs are averaged from three replicates of a representative experiment; error bars correspond to the standard error of the mean; **P < .005. ns indicates non significant. (b) Relative light production was used as means of assessing the levels of CAI-1 produced by WT V. cholerae in the absence or presence of indole (500 µM) and by ΔcqsA V. cholerae strain. Synthetic CAI-1 (10 µM) was used as a positive control. Data are averaged from three replicates of a representative experiment.
Figure 3. Indole competes with CAI-1 to influence EPEC T3SS activation. Wild type (WT) EPEC and escN null-mutant (ΔescN) EPEC were grown for 6 h under semi-optimal (a) or optimal (b) T3SS-inducing conditions in the presence of CAI-1 (50 µM) and various concentrations of indole (50–500 µM). The secreted proteins were concentrated from bacterial culture supernatants (bacterial sup) and analyzed via 12% SDS-PAGE and western blotting using an anti-EspB antibody. The expression of the effector protein Tir, was analyzed by subjecting the bacterial pellets to SDS-PAGE and western blotting using an anti-Tir antibody. Samples were also probed with anti-DnaK to confirm the equal loading of lysates.
Figure 4. Indole suppresses the upregulation of EPEC T3SS genes induced by CAI-1. WT EPEC was grown for 2 h under semi-optimal T3SS-inducing conditions in the presence of 0.5% (v/v) DMSO (dark gray bars), CAI-1 (white bars), indole (black bars), or both CAI-1 and indole (light gray bars). mRNA levels for the T3SS genes, espB, espA, and tir, were measured via qRT-PCR. mRNA levels are presented relative to those of WT EPEC grown in the presence of DMSO (dark gray bars). Data are averaged from three replicates of a representative experiment; error bars correspond to the standard error of the mean; **P < .005.
Figure 5. B. thetaiotaomicron-derived indole inhibits the enhancement of EPEC T3SS activity upon co-culture with V. cholerae. (a) Supernatants of WT B. thetaiotaomicron (B. theta) grown for 2, 4, 6 and 8 h and ΔtnaA B. thetaiotaomicron grown for 8 h were added to co-cultures of EPEC and V. cholerae grown in DMEM: BHI mixture aerobically, for 6 h. The bacterial pellets and supernatants (bacterial sup) were separated, normalized, and analyzed. The secreted proteins were concentrated from culture supernatants and analyzed via 12% SDS-PAGE and western blotting using an anti-EspB antibody. The expression of the effector protein Tir, was analyzed by subjecting the bacterial pellets to SDS-PAGE and western blotting using an anti-Tir antibody. Samples were also probed with anti-DnaK to confirm equal loading. (b) A schematic overview of the bacterial combinations and indole supplementation used for this experiment. WT EPEC was sub-cultured in a mixture of 1:1 (v/v) DMEM: BHI medium as pure culture (sample 1), a co-culture with V. cholerae (sample 2), a co-cultured with B. thetaiotaomicron (sample 6), or a tri-culture with V. cholerae and B. thetaiotaomicron (sample 4 with WT B. thetaiotaomicron and sample 5 with ΔtnaA B. thetaiotaomicron). B. thetaiotaomicron were pre-grown for 8 h before EPEC and V. cholerae were added. One of the EPEC and V. cholerae co-cultures was supplemented with 500 µM indole (sample 3). Pure cultures of WT and ΔtnaA B. thetaiotaomicron were used as negative controls (samples 7 and 8). All cultures were grown anaerobically for 6 h and their indole concentrations were determined (average values are highlighted in yellow). The bacterial pellets and supernatants (bacterial sup) were separated, normalized, and analyzed as described in panel A. (c) Relative light production was used to assess the levels of CAI-1 produced by WT V. cholerae when grown alone or in co-culture with either B. thetaiotaomicron (B. theta) or EPEC. Synthetic CAI-1 (10 µM) and the supernatant of ΔcqsA V. cholerae strain, which cannot produce CAI-1, were used as positive and negative controls, respectively. Data are averaged from three replicates of a representative experiment.
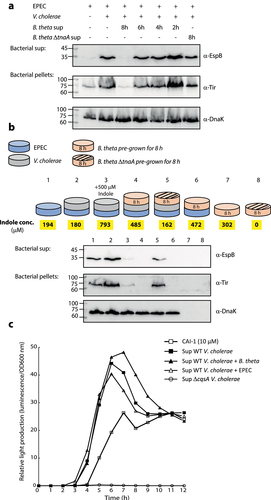
Figure 6. Indole reduces the ability of EPEC to translocate NleD into host cells, even in the presence of CAI-1. (a) HeLa cells were infected with WT and ΔescN EPEC strains grown under optimal T3SS-inducing conditions in the presence of various indole concentrations (100–1000 µM) for 3 h. Cells were washed, and their proteins were extracted and subjected to western blotting analysis using anti-JNK and anti-actin (loading control) antibodies. JNK and its degradation fragments are indicated to the right of the gel. (b) Western blotting analysis of JNK degradation patterns following HeLa infection with WT and ΔescN EPEC strains grown under semi-optimal T3SS-inducing conditions in the absence or presence of CAI-1 (50 µM) and indole (50 or 500 µM) for 2 h.
Table 1. Strains used in this study.
Table 2. Sequences of primers used in this study.
Supplemental Material
Download MS Word (179.8 KB)Data availability statement
The authors confirm that the data supporting the findings of this study are available within the article, its supplementary material, and are openly available in figshare.com at https://figshare.com/s/00f9b3e28246107780d9.