
Figures & data
Table 1. Characteristics of study participants.
Figure 1. Fecal microbial community composition in healthy controls and patients with RA. (a) Bacterial community composition at the genus level. (b) Pairwise comparison of abundant bacterial genera. (c) Fungal community composition at the genus level. (d) Pairwise comparison of abundant fungal genera. Taxa with abundance < 0.5% are grouped as “Low abundance.” In panels b and d, boxes and lines represent the interquartile ranges (Q3-Q1) and medians of relative abundances, respectively. Black dots indicate potential outliers. Lower and upper whiskers show minimum and maximum relative abundances of genera. Statistical significance was estimated by two-sided Mann–Whitney U test. ***, P < .001; **, P < .01; *, P < .05; ns, P > .05 (not significant). HC, healthy controls; RA, patients with RA.
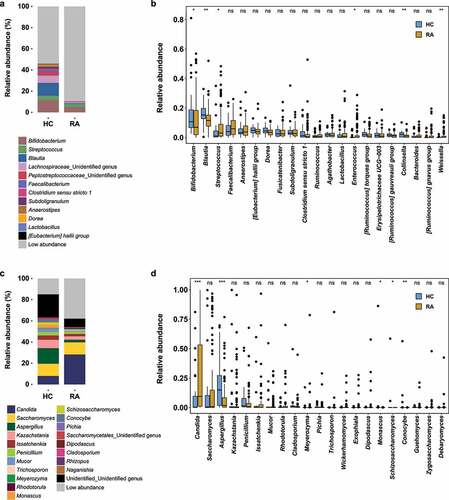
Figure 2. Ordination analysis of fecal bacterial and fungal communities in healthy controls and patients with RA. Compositional variations among samples were estimated by CAP, based on the Bray–Curtis distance metric. (a) Changes in composition of fecal bacterial and fungal communities. HC samples are shown in blue; RA samples are shown in dark yellow. (b) Ordination analysis according to the relative abundances of abundant genera. Greater intensity denotes higher relative abundance. Left and right sides of panels a and b are bacterial and fungal communities, respectively.
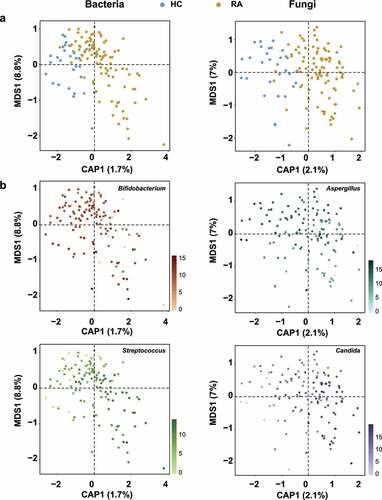
Figure 3. Microbial signatures associated with RA. A random forest model was used to identify OTUs that explain the gut bacterial (a) and fungal (b) communities. OTUs are colored based on their classification as “HC-enriched” and “RA-enriched,” based on the results of differential abundance analysis (Figure S5a, S6a). Random forest models were constructed using a 10-fold cross-validation method. OTUs are arranged along the y-axis according to total abundance. Each mark on the x-axis indicates an individual HC or RA sample.
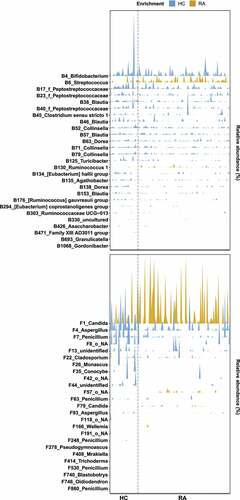
Figure 4. Interkingdom co-occurrence networks and hub nodes of fecal microbiota. (a) Interkingdom HC networks. (b) Interkingdom RA networks. In panels a and b, each node corresponds to an out; edges between nodes correspond to positive (black) or negative (red) correlations inferred from OTU abundance profiles using the SparCC method (P < .05, correlation values of < −0.3 or > 0.3). OTUs that belong to different microbial kingdoms are indicated by colors (bacteria, ivory; fungi, green), and node size reflects degree of centrality. (c) Hub nodes of microbial HC networks. (d) Hub nodes of microbial RA networks. In panels c and d, the hub was defined as a node in which degree, betweenness centrality, and closeness centrality were in the top 1%. Dashed lines indicate threshold values of degree, betweenness centrality, and closeness centrality.
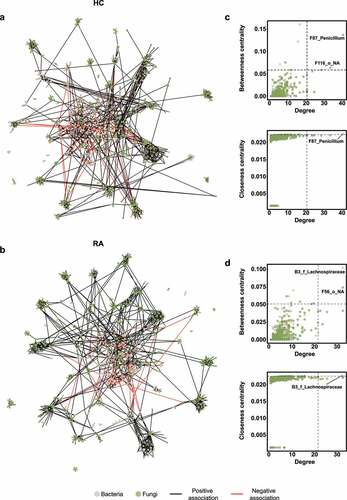
Figure 5. Effects of medication on Candida abundance. (a) Fecal microbiota composition according to medication. (b) Relative abundance of Candida. Letters indicate statistical significance, as determined by Kruskal–Wallis test followed by Dunn’s test. (c) Results of quantitative PCR analysis of C. albicans. Letters indicate statistical significance, as determined by analysis of variance followed by Tukey’s honestly significant difference test. (d) Correlations between relative abundances of fungal OTUs and quantitative variables. Correlation coefficients were estimated using Spearman’s rank correlation. Asterisks indicate statistical significance (***, P < .001; **, P < .01; *, P < .05). Red and blue boxes indicate positive and negative correlations, respectively.
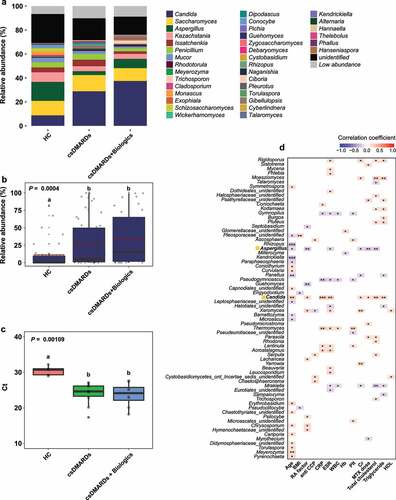
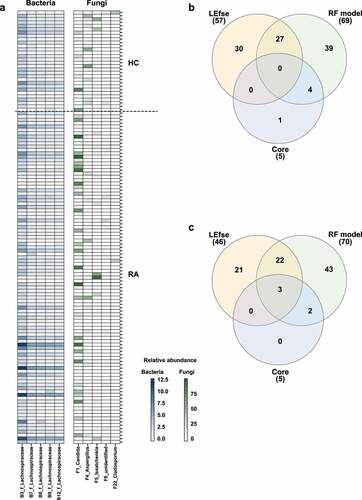
Figure 6. Analysis of core OTUs in fecal microbiota. (a) Core OTUs were identified based on 85% prevalence for bacteria (dark blue) and 70% prevalence for fungi (dark green). Box colors indicate relative abundances of OTUs. Greater color intensity indicates higher relative abundance. Each mark on the y-axis indicates an individual sample. Venn diagrams of the numbers of (b) bacterial and (c) fungal OTUs identified by LEfSe, the random forest model, and core out analysis.
Supplemental Material
Download MS Word (3.1 MB)Data availability statement
All raw sequences derived from this experiment were submitted into the Sequence Read Archive of NCBI and can be found under the BioProject accession number PRJNA791216. Metadata files, R data files, and R notebooks for full analyses are available from https://github.com/hyunkim90/rheumatoid_arthritis_and_mycobiota