
Figures & data
Table 1. Demographics and descriptive statistics for study participants.
Figure 1. Significant differences in macro- and micronutrient intake between CF (n = 19) (red) and HC (n = 19) (blue) groups. Values are adjusted for total energy intake. Shaded regions represent 95% confidence intervals constructed from generalized linear models controlling for age; solid line represents mean.
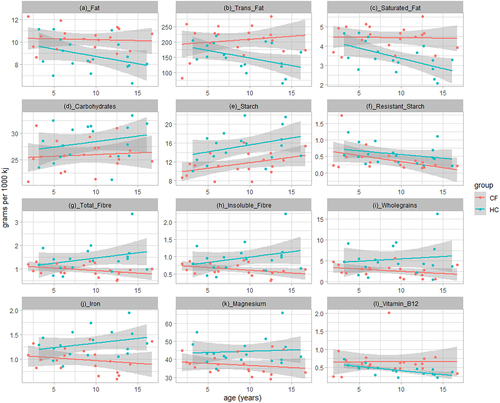
Figure 2. Bacterial alpha and beta diversity for stool (CF n = 33, HC n = 33) and airway samples (CF n = 41, HC n = 41). Richness was determined by number of zOTUs (a) and Shannon diversity index (b). Shaded regions represent 95% confidence intervals constructed from generalized linear models controlling for age; solid line represents mean. Beta diversity was calculated with Bray-Curtis dissimilarity to generate non-metric multidimensional scaling (NMDS) plots based on relative abundances (e) and presence/absence data (f).
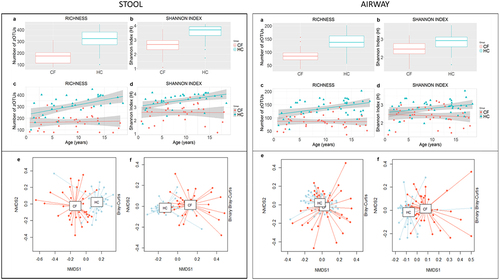
Figure 3. Diagrammatic representation of spearman correlations in the multisystem context of cystic fibrosis. (s) = stool genera; (a) = airway genera; FEV1% = percentage predicted forced expiratory volume over one second; CFPE = CF pulmonary exacerbations in the last three years. Blue line = negative correlation, red line = positive correlation, purple line = both positive and negative correlations.
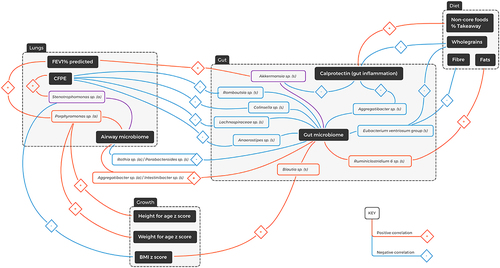
Table 2. Clinical measurements available for CF study participants.