
Figures & data
Figure 1. Cohort construction and microbiota characteristics of three IBS subtypes. (a) Conceptual outline of cohort construction and classification; (b) Principal Coordinates Analysis of gut microbiota composition of patients with different IBS subtypes by Bray-Curtis dissimilarities, the difference among IBS subtypes was assess by PERMANOVA test. (c) Diversity (Shannon Index) and richness of gut microbiota of IBS patients and non-IBS controls in different subtypes, * p < .05, ** p < .01, *** p < .001, **** p < .0001; (d) Principal Coordinates Analysis of gut microbiota composition of patients with different IBS subtypes and corresponding non-IBS controls by Bray-Curtis dissimilarities, the difference among IBS subtypes was assess by PERMANOVA test.
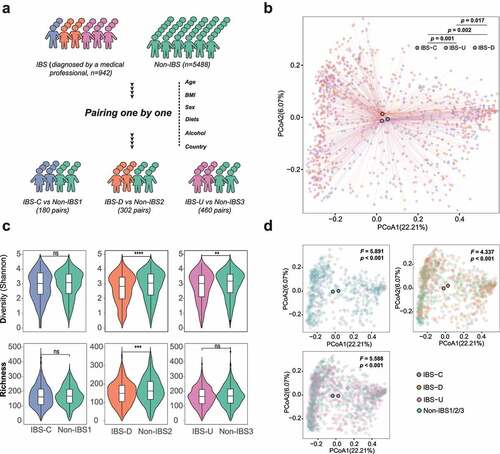
Table 1. Demographics of involved IBS patients and non-IBS controls.
Figure 2. Compositional and functional alterations in gut microbiota of patients with different IBS subtypes. (a) The alterations of six phyla in different IBS subtypes by comparing to corresponding non-IBS control; (b) The alterations of 37 genera in different IBS subtypes by comparing to corresponding non-IBS control; (c) 64 microbial genera that only altered in one specific IBS subtype. The alteration was assessed by comparing IBS cohort and non-IBS cohort for each subtype using the linear discriminative analysis (LDA) effect size biomarker discovery tool (p < .05, LDA >2, FDR<0.1). (d) Volcano plots demonstrating bacterial MetaCyc pathway alterations in IBS-D, IBS-U and IBS-C; A binomial test was used to calculate the p values for the up-regulation or down-regulation of MetaCyc pathway in the IBS cohort versus the non-IBS cohort for each subtype. Colored dot indicate pathway with FDR- adjusted p < .05.
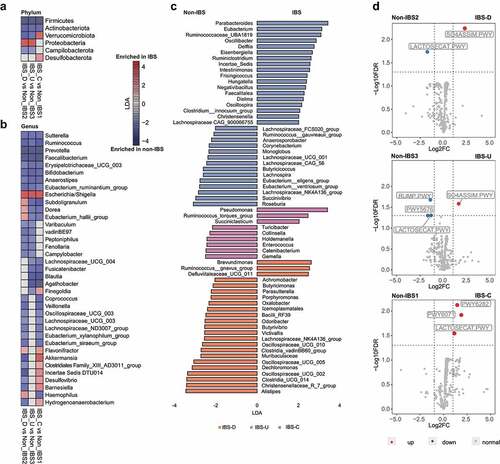
Figure 3. Bacterial and functional alterations in gut microbiota of IBS patients with depression. (a) Diversity (Shannon Index) and richness of gut microbiota of IBS patients with depression or without depression in different subtypes, NS means not significant. (b) Principal Coordinates Analysis of gut microbiota composition of IBS patients with depression corresponding IBS patients without depression in different subtypes by Bray-Curtis dissimilarities, the difference among IBS subtypes was assessed by PERMANOVA test. (c) The association between gut microbiota and IBS patients with depression in different subtypes. The association was assessed by the multivariate analysis by linear models (MaAsLin; p < .05, FDR<0.1). (d) MetaCyc pathway differences between IBS patients with depression and those without depression, * p < .05, ** p < .01, *** p < .001, **** p < .0001. In each subtype, an equal number of IBS patients without depression were selected using the established matching algorithm.
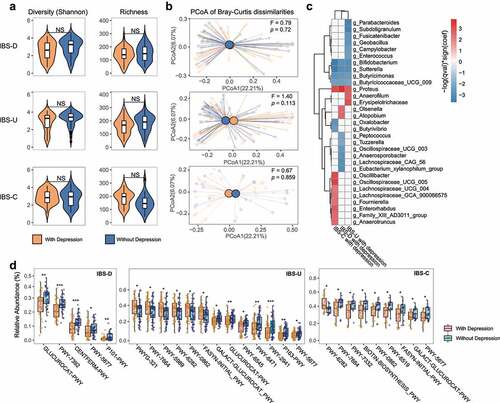
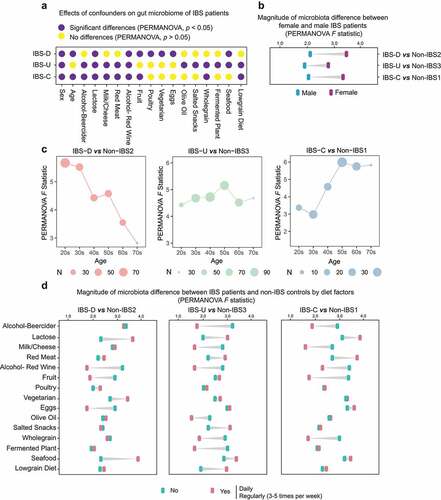
Figure 4. Effects of age, gender and dietary factors of the gut microbiota in IBS patients. (a) The effects of host confounders on gut microbiome of IBS patients (PERMANOVA, p < .05), IBS means all patients without subtyping. (b) Differences between beta-diversity-based F statistic of IBS patients and non-IBS controls grouped by gender in different subtypes. (c) Differences between beta-diversity-based F statistic of IBS patients and non-IBS controls grouped by age in different subtypes. (d) Differences between beta-diversity-based F statistic of IBS patients and non-IBS controls grouped by diets in different subtypes. “No” means never eat the specific food, and “Yes” means eating this kind of food at a high frequency (daily or regularly).
Supplemental Material
Download Zip (4.8 MB)Data availability statement
Sequences and metadata are available from the European Bioinformatics Institute (EBI) database under project ID: PRJEB11419 (https://www.ebi.ac.uk/ena/browser/view/PRJEB11419).