
Figures & data
Figure 1. In silico analyses and identification of PIP motif of CaPol32. a. Multiple amino acid sequence alignment of CaPol32 with ScPol32, SpCdc27, and human p68 (Hsp68) using CLUSTAL W. Identical residues are designated by * and similar residues are designated with symbols: . N-terminal domain (NTD), Pol1 binding site, and PIP motif are shaded with brown color, green, and violet color, respectively. b. Glutathione sepharose beads bound with GST-CaPol32 (Lanes 1–3) and GST-CaPol32 (F398A, F399A) (Lanes 4–6) were mixed with CaPCNA in the equilibration buffer. After the incubation, beads were washed with equilibration buffer and bound PCNA was eluted by protein loading dye. Various fractions were resolved in 12.5% SDS-PAGE and binding of PCNA was detected by an anti-CaPCNA antibody. c. ITC analysis of binding of CaPCNA with CaPol32 and CaPol32 (F398A, F399A). In each figure, the upper panels show the measure of heat exchanges during each CaPCNA injection, while the lower panels show enthalpy changes as a function of the molar ratio of CaPol32 or CaPol32 (F398A, F399A) binding to a CaPCNA monomer.
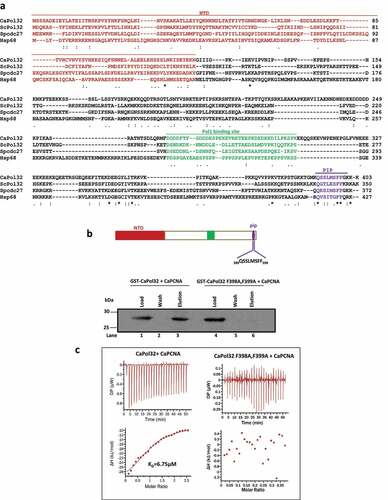
Figure 2. PIP motif of CaPol32 is essential for CaPolδ’s function. a. Serially diluted cells of WT, pol32ΔΔ, pol32ΔΔ::POL32, pol32∆∆::POL32 F398A, F399A C. albicans strains and pol32Δ deletion S. cerevisiae strain harboring vector alone or ScPol32 or ScPol32 F344A, F345A were spotted on YPD plates with the indicated concentration of HU. Similar YPD plates spotted with various strains were exposed to different doses of UV. All the plates were incubated at 30°C for 48 hr and then imaged. For the temperature sensitivity, YPD plates were incubated at 16°C, 30°C. 37°C, and 42°C for 48 hr and then photographed. b. CFU analysis of various strains of C. albicans and S. cerevisiae was performed by diluting logarithmically growing cells to 400 cells/ml and from which 250 µl cells were spreaded on YPD plates with HU (i) and UV treatments (ii). c. Equal number of cells of WT, pol32ΔΔ, pol32ΔΔ::POL32, pol32∆∆::POL32 F398A, F399A C. albicans and pol32Δ S. cerevisiae strain harboring a vector alone or ScPol32 or ScPol32 F344A, F345A plasmids were spotted on YPD plates without or with MMS, cisplatin, and TBHP. All the plates were incubated at 30°C for 48 hr and then imaged.
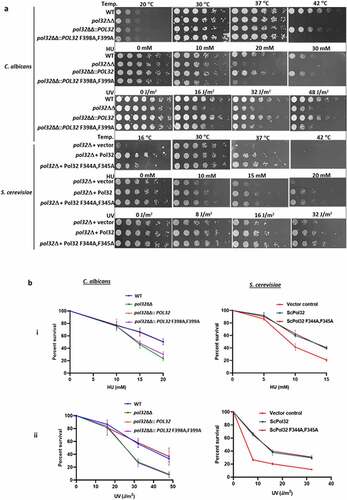
Figure 2. (Continued).
Figure 3. Role of CaPol32 in chromosomal stability and cell cycle progression. a. DNA plugs were prepared for various strains of C. albicans and resolved by PFGE. b. Alkaline agarose gel electrophoresis of total DNA isolated from Pol32ΔΔ::POL32 (lanes 1–4), pol32ΔΔ (lanes 5–8), and pol32ΔΔ::POL32 F398A, F399A (lanes 9–12) strains of C. albicans during the recovery period after HU treatment was carried out. After neutralization, DNA fragments were visualized by ethidium bromide staining. c. The efficiency of LOH of various strains of C. albicans was measured by estimating the number of FOA resistant colonies. d. Synchronized cells were chased for 150 mins at an interval of 30 mins to check the cell cycle progression of C. albicans cells without or with HU treatment. Cells were stained with cytox green and a single cell gated population was analyzed by flow cytometry.
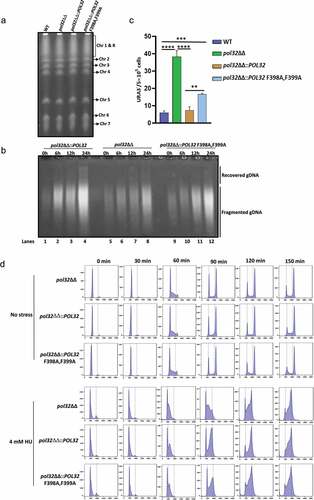
Figure 4. WGS of pol32ΔΔ strain of C. albicans. a. The raw FASTQ genome sequence files of our laboratory WT (i) and pol32ΔΔ (II) strains of C. albicans were mapped with reference sequence using YMAP. YMAP provided the chromosomal map. The gray color lines indicate heterozygous regions in both haplotypes and the cyan and magenta lines indicate heterozygous regions in any of the haplotypes. The histogram at the left arm of the chromosome represents the proportion of each haplotype (assigned as a or b). The histogram at the right end of the chromosome indicates the copy number variation. Chromosome 7 of pol32ΔΔ strain showed segmental aneuploidy and brown circles indicate some of the unique variation regions. b. Numbers of Indels (i) and SNPs (ii) specifically accumulated in the genome of pol32ΔΔ strain of C. albicans. Blue color indicates deletion, brown color indicates insertion, gray color indicates homozygous Indels, yellow color indicates heterozygous Indels, Orange color indicates homozygous SNPs, sky blue color indicates heterozygous SNPs, green color indicates transition mutation, and maroon color indicates transversion mutation. c. Accumulation of Indels and SNPs associated without or with homo/hetero-polymeric repeat regions of pol32ΔΔ genome of C. albicans. d. The frequency distribution of length of deletion and insertion specific to pol32ΔΔ genome of C. albicans.
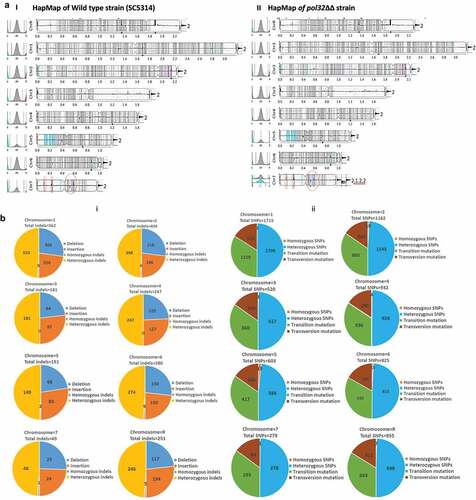
Figure 4. (Continued).
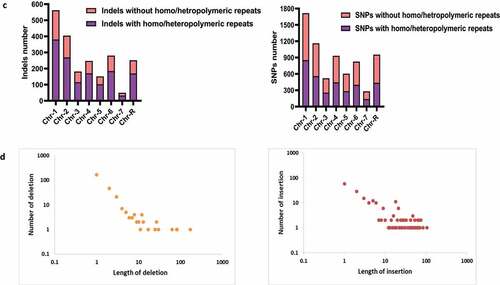
Table 1. Accumulation of indels and SNPs only due to the loss of POL32 gene in C. albicans strain.
Table 2. Repeat regions specific accumulation of indels and SNPs only due to the loss of POL32 gene in C. albicans strain.
Figure 5. Morphogenesis of C. albicans strains. a. Cells from various strains of C. albicans were grown in liquid media for 4 hr in the presence or absence of various genotoxic agents as indicated and morphology was observed under a light microscope. b. Overnight cultures of various strains of C. albicans were diluted to 500 cells/ml, from which 200 µl cells were spreaded on YPD plates with 10% FBS, spider agar plates, and 10% FBS agar plates. All the plates were incubated at 37°C and images were taken at mentioned time points (i). Cells from YPD +10% FBS agar plates were taken, fixed, and stained with CFW, and images were captured under a fluorescent microscope (ii). c. Cells of WT, pol32ΔΔ and pol32ΔΔ::POL32 strains were grown for 1 hr in YPD liquid media containing 10% FBS and observed under the light microscope. The length of the germ tubes was measured using image j software and represented in dot plots. d. Expression of various virulence and hyphal associated genes were quantified by real-time PCR. GAPDH was used as a control. The results are presented as mean ± standard deviation. Asterisks indicate the statistically significant differences compared to the results of the WT using the student t-test (*P < .05).
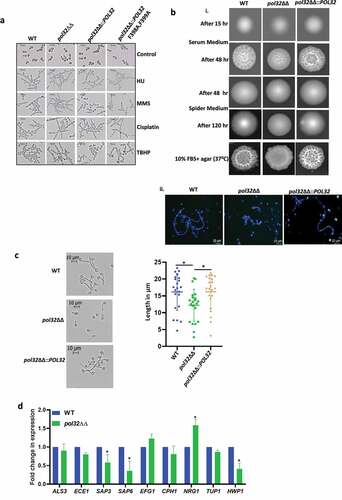
Figure 6. Antifungal drug susceptibility. a. Overnight cultures of WT, pol32ΔΔ and pol32∆∆::POL32 strains were serially diluted and spotted on YPD plates without or with the indicated concentration of various antifungal drugs. All the plates were incubated at 30°C for 48 hr and photographed. b. Overnight grown cultures of WT, pol32ΔΔ and pol32ΔΔ::POL32 strains were diluted in fresh YPD media and grown at 30°C in the absence or presence of fluconazole (6 μM). The absorbance was measured at OD600 for 15 hr at an interval of 3 hr and was plotted using Graph pad prism 8.0. The experiment was performed in biological duplicates and repeated twice. c. Serially diluted cultures of WT, pol32ΔΔ, and pol32∆∆::POL32 strains were spotted on YPD plates without or with indicated concentrations of SDS, CaCl2, CFW, rapamycin, berberine, and Congo red. Plates were incubated at 30°C for 48 hr and photographed. d. Cells from various strains of C. albicans were stained with CFW, berberine and Congo-red and analyzed by flow cytometry. The mean fluorescence intensity from 3 independent experiments were plotted using Graph Pad Prism 8.0. The results are presented as mean ± standard deviation. Asterisks indicate the statistically significant differences between WT, pol32ΔΔ, pol32ΔΔ::POL32 using the student t test (**P < .01, ***P < .001) e. Quantification of the expression of genes associated with azoles drug resistance by real-time PCR. GAPDH was used as a control. The results are presented as mean ± standard deviation. Asterisks indicate the statistically significant differences compared to the results of the WT using the student t-test (*P < .05; **P < .01). f. Serially diluted cultures of WT, pol32ΔΔ, and pol32ΔΔ::POL32 were spotted on YPD plates containing either indicated concentration of geldanamycin, trichostatin A, fluconazole, and in combinations. All the plates were incubated at 30°C for 48 hrs and photographed. g. The absorbance of pol32ΔΔ strain in YPD media in the presence or absence of fluconazole alone, geldanamycin alone or in a combination of both at 30°C was measured and plotted. h. The absorbance of pol32ΔΔ strain in YPD media in the presence or absence of fluconazole alone, trichostatin A alone or a combination of both at 30°C was measured and plotted.
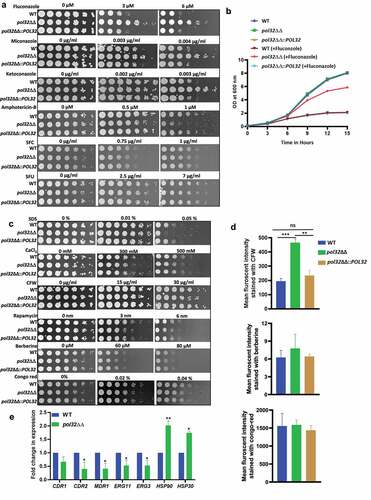
Figure 6. (Continued).
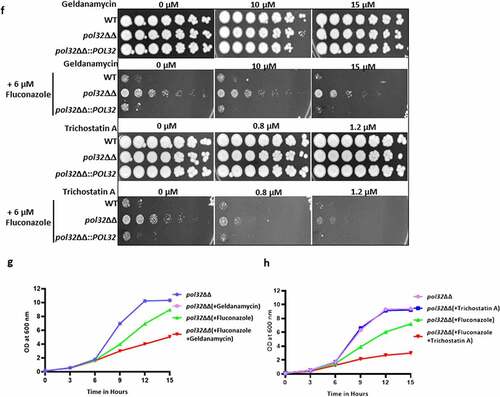
Figure 7. Ultrastructure of C. albicans cell. a. TEM images of ultra-thin sections of WT, and pol32ΔΔ depicting assembly of intact yeast cells, scale bar = 2 μm (i), an individual cell, scale bar = 1 μm (ii), and (iii) the thickness measurement of individual cell wall. Samples visualized up to a magnification of 14000X. Arrow indicates the zoom in image of the marked cell. b. Glucan content of the WT, pol32ΔΔ and pol32ΔΔ::POL32 cells as estimated by aniline blue assay.
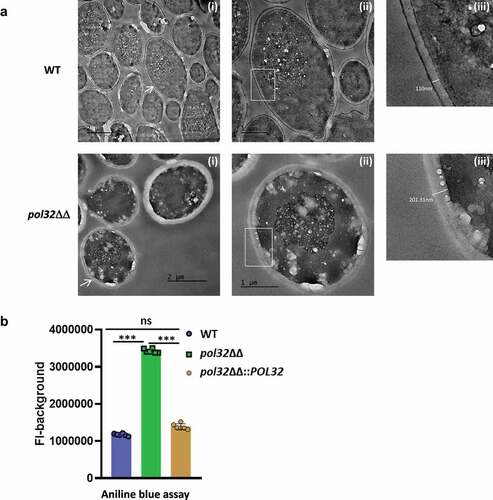
Figure 8. Biofilm estimation by crystal violet assay and Confocal Laser Scanning Microscopy (CLSM). a. The WT, pol32ΔΔ and pol32ΔΔ::POL32 strains of C. albicans (n = 4) were grown in YPD media with 10% FBS in 24 wells polystyrene plates for 24 hrs at 37°C. The wells were washed with PBS and stained with 0.05% crystal violet (i) and their absorbance was measured at 570 nm (ii). The obtained absorbance was plotted using Graph pad prism 8.0. The results are presented as mean ± standard deviation. Asterisks indicate the statistically significant differences compared to the results of the WT using the student t-test (**P < .01). b. WT, pol32ΔΔ and pol32ΔΔ::POL32 strains of C. albicans (n = 2) were grown on 6-wells polystyrene plates containing glass coverslips for 24 hrs at 37°C. The biofilm formed on the coverslip was stained with 1% acridine Orange and images were captured using Leica TCS SP8 confocal system with an excitation wavelength of 483 nm and emission wavelength of 510 nm. Upper panel is 3D image and lower panel is 2D image.
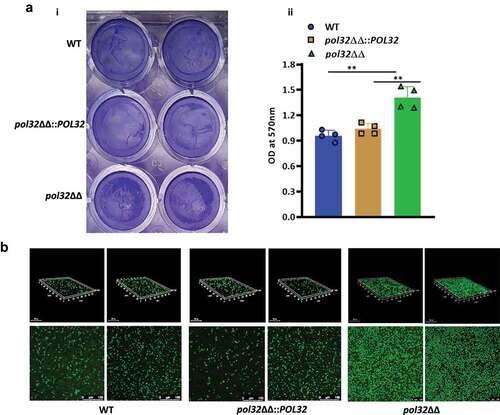
Figure 9. Mice model of systemic candidiasis. a. Male BALB/c mice of 6–7 weeks of age were inoculated either with WT or pol32ΔΔ or pol32ΔΔ::POL32 (5x10⁶ CFU) C. albicans strains intravenously along with saline control and monitored their survival for 30 days. The survival curve was plotted using Graph pad prism 8.0 software. b. The murine kidney, liver, and spleen were collected and fungal burden was measured in all these organs by CFU determination. c. The kidneys of WT and pol32ΔΔ::POL32 mice (n = 2) were stained with PAS staining and images were captured in a light microscope with 40X magnification.
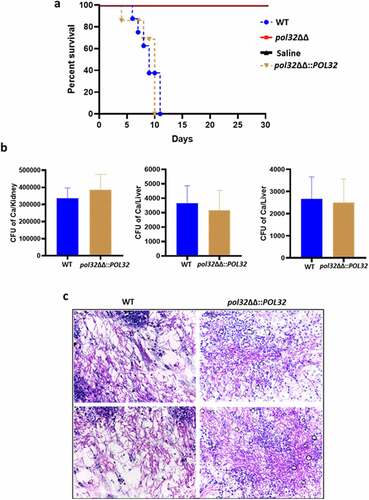
Figure 10. Lack of Pol32 links genome instability with C. albicans pathogenesis. It is a pictorial representation of the consequences of the deletion of POL32 gene in C. albicans. Loss of Pol32 subunit renders replication stress by decreasing the processivity of Polδ, thereby inducing genome instability and delay in cell cycle progression. Critical hyphal and virulence genes get dysregulated to result in reduced filamentation, azoles resistance, enhanced biofilm formation, increased cell wall thickness with altered composition, and avirulency.
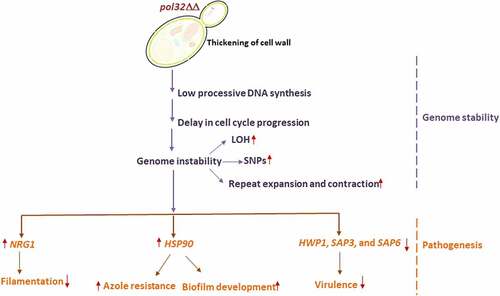
Table 3. Various strains used for this study.
Table 4. Primers used for real-time PCR.